Client Update September 29 – An Opportunistic Entry Point For Stocks In The Near Future May Be Upon Us

September 29, 2021

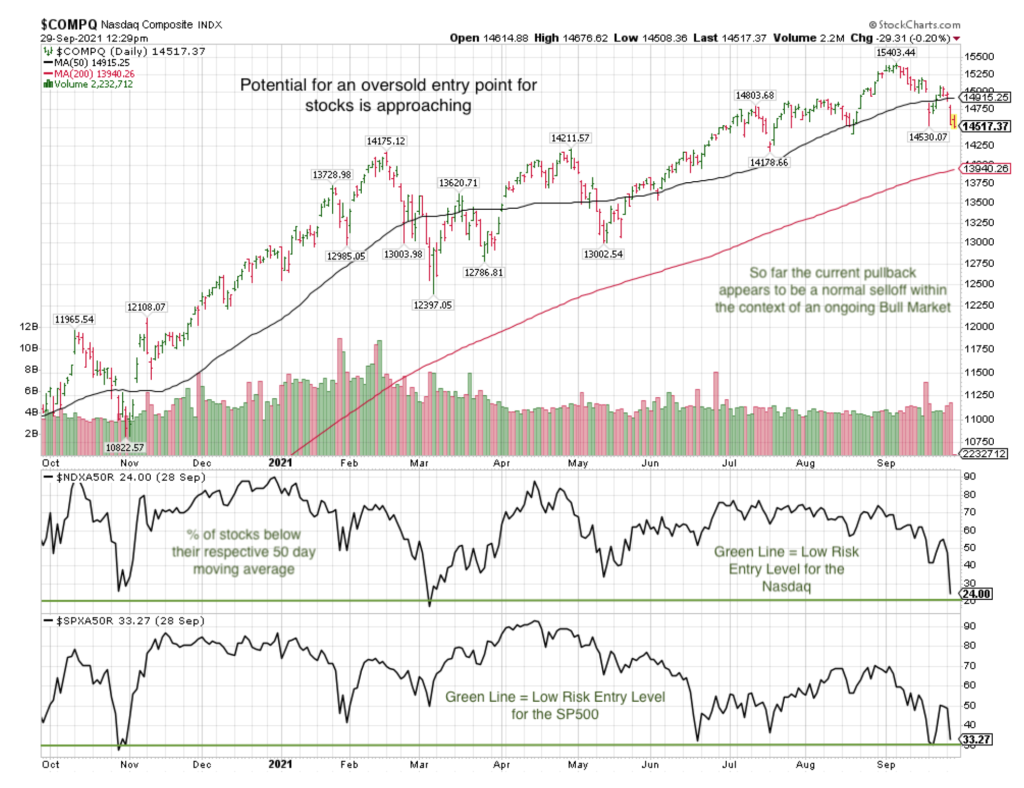
We are potentially arriving at a point where a good risk/reward entry point for stocks may present itself. There has been a frustrating lack of entry opportunities for equities this year. However the concerns regarding the Fed’s future change of course appears to be having the desired affect of stomping out excessive enthusiasm.

Fear is almost always present at market lows. Or, as long time market technician Walter Deemer used to say: “When it’s time to buy you won’t want to. When it’s time to sell you won’t want to.”

vegan investing, socially responsible investing

As much as I loathed the sell off for the past two days, it has created driven down the markets to the point where it’s time to think about adding to our holdings. At present we are in the weakest portion of the year for stocks. This will give way in approximately two weeks to the strongest seasonal tendency from October thru March.

It’s too early to do any serious buying today and possibly next week. I’ll continue to wait until buy signals appears before moving aggressively.

Changes to the stock selection and holding process

Markets are always in a state of evolution in trends. What worked in years past will likely not work in the future and visa versa. For most of my career in portfolio management I’ve changed strategies to fit and improve performance going forward.

It has been a difficult year for RMHI as it has been for the vast majority of technical trend traders. 2021 has been a year where a “buy and hold” approach worked well but only for a tiny majority of stocks. I’d place these stocks and their inherent characteristics in what I’d call “Stable Growth Leaders” or SGL.

The most common characteristic of SGL’s is their consistent moderately high earnings and sales growth. In addition, this category of stocks must also maintain performance greater than the market indices for a multiple of years.

I scan my screens daily for SGL’s but on any given day there might only be 10 to 15 that meet my parameters.

My strategy is to have at least 50% of account assets in these names, many of which are already in your accounts now. These are not intended to be traded actively unless they drop or rise precipitously, like Adobe Systems did recently.

Presently, the following meet my criteria and are in client portfolios today. So you know we only have partial positions in accounts right now. I’ll add to them should the market stabilize and begin to rally:

Entegris
Epam Systems Fortinet
Ihs Market Ltd Intuit
Johnson Controls SVB Financial Group

Current market weakness creates and ideal entry point for these kinds of stocks. While I’ve only listed 7 names, several more companies have fallen back in their buy zones.

With the exception of SVB Financial which is in the black for us. The other holdings have moderate to small losses. Thats ok for now. These names have repeatedly bounced back from sell-offs in years past before resuming moderate and steady appreciation.

The balance of our holdings will be the classic technical trading that works very well in strong markets.

In creating this form of hybrid methodology is an effort to create more balance where at least one strategy could be working while the other does not.

In addition, both technical and SGL’s will work initially after a good market sell off like we’re in the midst of right now.

Thank You,

Brad Pappas

Vegan Humane Investing


Client Update September 21 – Stock Market Weakness in September, Right On Time.

September 21, 2021

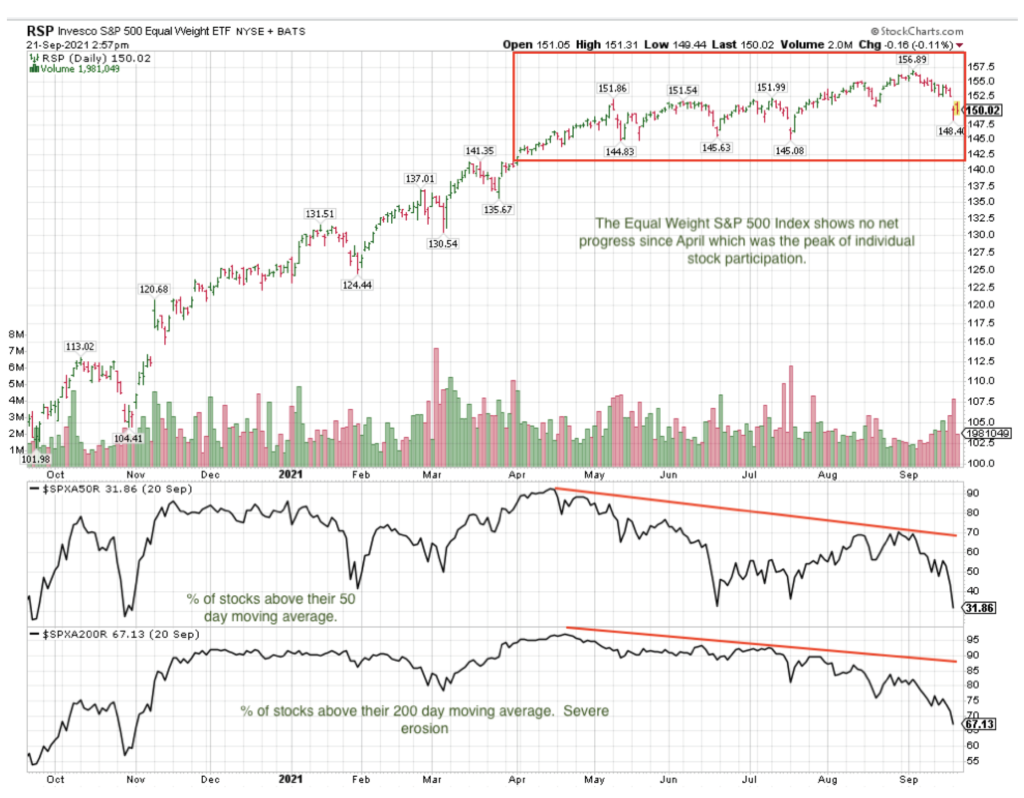
For months I’ve been writing and saying that the major market indices have been masking the erosion of individual stock declines. When we see this type of erosion with underlying stocks it usually means there is a broad selloff coming.

What made the erosion unique in 2021 has been how long it’s been sustained. The percent of stocks above their respective 200 day moving average peaked in April 2021 and has been declining ever since. I believe this is the longest streak since 2000.

vegan investing, socially responsible investing

Unless you’e a day trader it’s very difficult to show sustainable profits when the tide is moving out.The erosion accelerated in July to the point where the indices have finally given way.

This should be considered a pullback within an ongoing long term bull market and not the start of something more severe.

As always there are a lot worries out there:

The Republican stance of not raising the debt limit is phony and the limit will be increased.

The Chinese governments attempt to control the Evergrande debt fiasco poses risks for the Chinese economy which is the driver of world economic growth.

Chmn. Powell’s testimony tomorrow will likely be mild. He has enough issues on his plate to cover his dovish stance for quite a while longer.

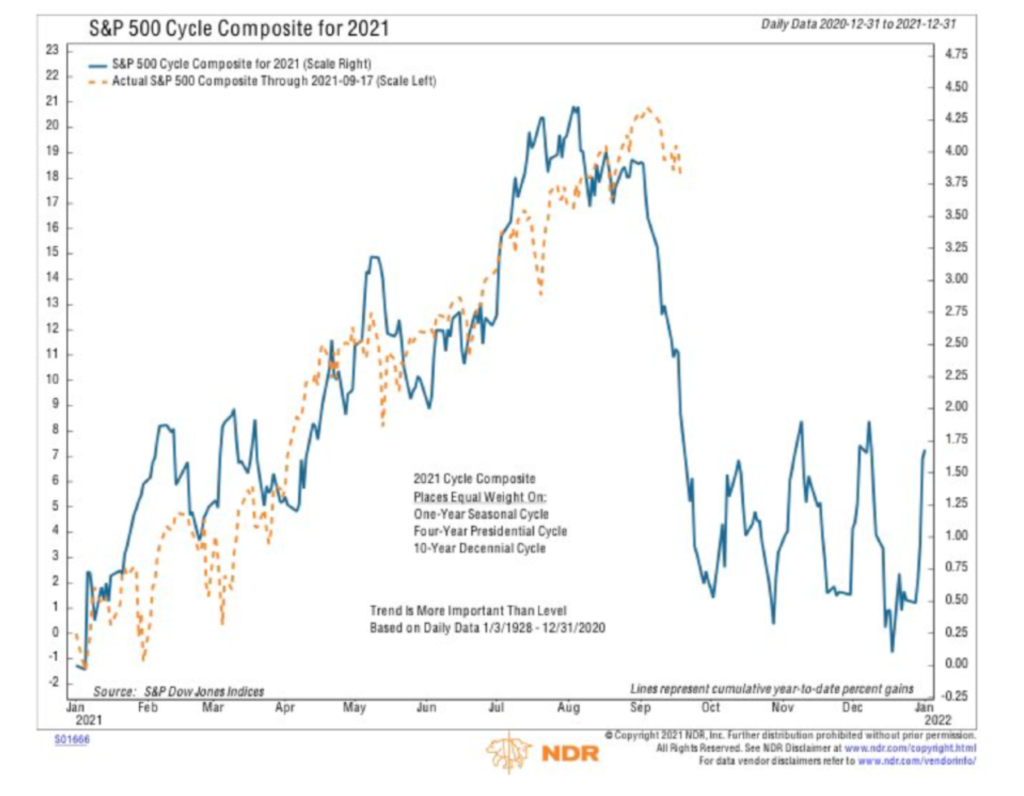
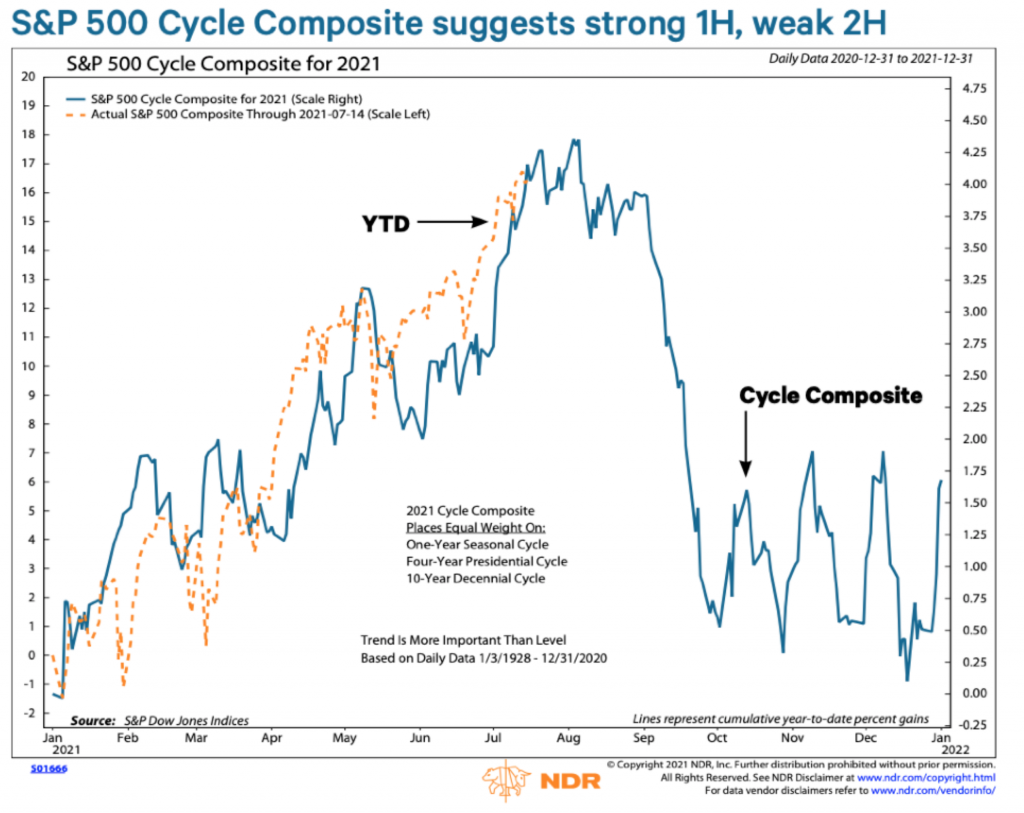
I previously showed the chart below this Summer with the understanding that going into the weakest months of the year. Correspondingly once we emerge from early October we’ll be entering the strongest months of the year.

Covid luddites prolonging the pandemic.

vegan investing, socially responsible investing

In my opinion the market weakness is a buying opportunity once the markets stabilize. The chart says late September or early October.

Plus, Monetary policy remains easy which is conducive to a bull market.

Summary: This appears to be a garden variety market selloff and not the start of something more significant. Monetary policy in the US would have to severely change in order for a prolonged bear market to emerge. This is not the case today.

My hope is that this selloff puts and end to the waning individual stock participation it usually does. And, in doing so creates enough fear and angst for a new leg higher for stocks and the indices.

Sincerely,

Brad Pappas

Vegan Humane Investing


Client Update August 9, 2021 – Markets erosion under the surface

August 9, 2021

Imagine watching a long bridge over water filled with traffic. The bridge appears stable and strong with no sign of weakness on the roadbed. But if you look below to the bridge foundation you see individual bits of brick, mortar and concrete fall into the water.

The bridge road surface is still stable but for how long? And, would you be willing to cross it?

This is my attempt at an analogy of the broad market indices today. Markets are stagnant but stable on the surface. However severe erosion exists beneath the surface which has made investing increasingly difficult. Trades that normally would hold value after a few days are reversing after days 2-4.

For example, the Nasdaq 100 made a new all-time high today (8/5) but only one stock from the index made a new high as well: Costco.

In this letter I show how there have been several periods like this in the past. While its not 100% assurance that a good sized sell-off ensues, its a high probability occurance. Periods like today with eroding stock participation are before sell-offs in excess of 5%-10%+.

From my observational view when I run into trouble buying into a series of high probability trades that end up not working out, I stop. By stopping I want to see why my textbook entries are not working out as they should in a healthy market. Recently there have been a few textbook trades that are strong on day1 but run into trouble after day 2 or 3. Whats happening?

What is happening is that big institutional firms are selling into the rallies rather than making additional buys that can propel the stock higher. We’ve had cases where this has not happened such as with Adobe, Align Tech or Cloudfare. But we’ve taken enough small losses to force me to pause.

Bob Farrell is Old School. He was the Chief of Technical Analysis at Merrill Lynch when I first broke into the business in the early 80’s. In his Ten Lessons of Investing is the following quote:

Markets are strongest when they are broad based and weakest when they narrow to a handful of blue-chip names.” And that describes exactly where we are in August 2021.

Since July, equity markets have become a chop-fest. Up, down, up, down with zero consistency while the percentage of stocks above important moving averages continues to decline.

This erosion in the markets is being masked by the largest % weightings in the S&P 500 index. The S&P 500 is not a group of 500 companies weighted equally so it’s possible to prop up an index with heavy buying of the highest weighted stocks.

Apple 5.5%
Microsoft 5.3%
Google aka Alphabet A & C shares 4%
Amazon 3.9%
Facebook 2.2%

At the moment we are time period where companies are reporting earnings and expectations for the second half of the year. And, there is a trend emerging in which Amazon, UPS, Facebook, Apple are reporting that the first half of the year revenue growth was unsustainably great that it was borrowing from the second half of the year. In other words, all 4 companies that benefited from the Covid crisis are expecting declines in demand and revenues for the second half of the year.

In addition, we can expect the Fed to begin easing off their purchases of Treasuries and Mortgage backed securities – as if the real estate market isn’t hot enough.

These are my thoughts as to why we could experience a sharp down move in stocks in the coming two months – August and September happen to be two of of the worst months for stocks. But at this point these are opinions that have yet to be validated by the markets.

Based on the chart below, the cycle peak for stocks was last week. Maybe its accurate, maybe not. It’s interesting regardless.

vegan investing, socially responsible investing

Now lets drill down to facts:

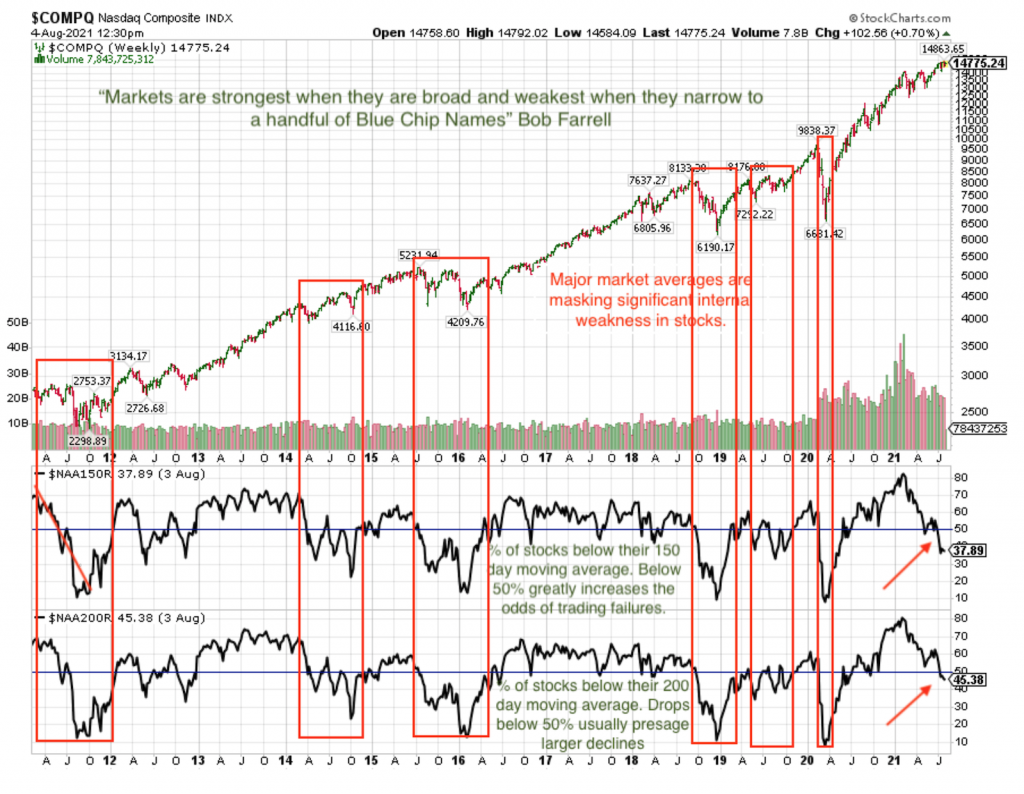
The Nasdaq composite remains elevated but without serious weakness at the surface. This is due to the pegging of Google, Apple, Microsoft, etc expressed previously.

Below the surface to individual stocks there is a very different story. Serious erosion in the average stock while the indices remain high. As the chart shows this is not a rare occurrence but it usually leads eventually to significant market weakness.

The percent of stocks below their respective 150 and 200 day moving averages (dma) continues to grow. The Bob Farrell quote comes to mind here.

What is happening is that investors are cutting their losses in stocks and then shifting the assets to FANG + M (Facebook, Apple, Netflix, Google and Microsoft). In a sense they’re hiding in extremely large and liquid shares.

If there is a serious market decline those who’re buying FANG + M will sell those as well.

vegan investing, socially responsible investing

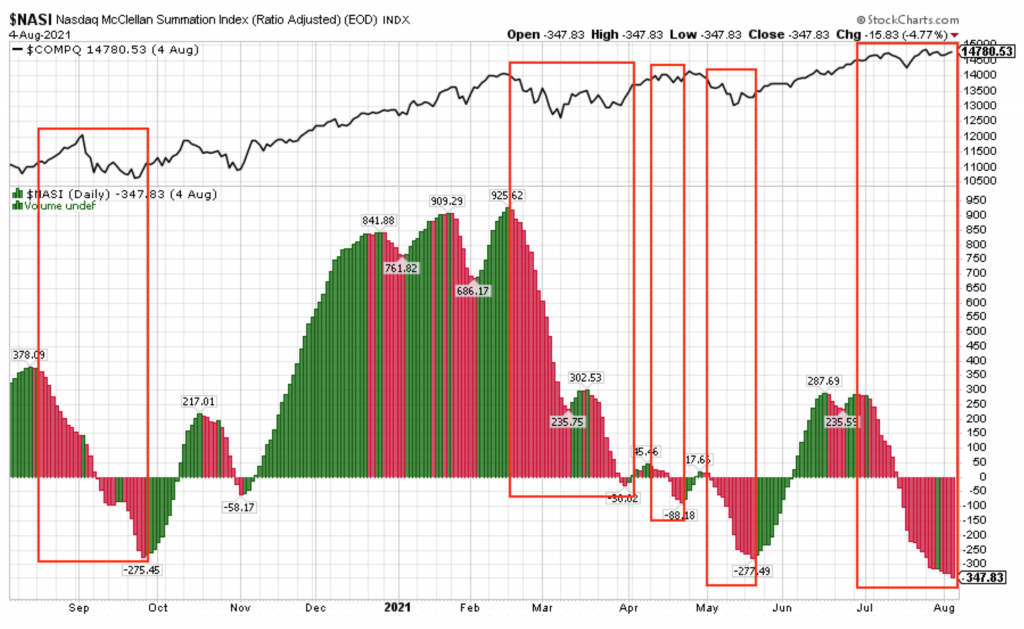
Another method of analyzing the erosion in participation (market breadth) is the Nasdaq McClellan Summation Index (NASI) which has clearly been on a Sell recommendation since July.

vegan investing, socially responsible investing

Every major market pullback in the last 20 years show declining market breadth before the bulk of the selling began. However, not every period of declining breath presaged a sizable market pullback.

Should market breadth begin to improve, I plan on increasing our percentage invested. In the meantime its very difficult to sustain meaningful gains with the current erosion in stock participation.

Like everything else market-wise this is a temporary condition. Its just not an ideal time to be aggressive and fully-invested.

Thank you for reading.
Brad Pappas
August 9, 2021

Vegan Humane Investing


Client Update May 25, 2021 – Markets Shifting Back to Growth

Markets Shifting Back To Growth 

May 25, 2021

Apologies for the delay in writing this draft. If the facts are in the midst of changing I prefer to hold my thoughts until I’m more confident to admit them to paper.

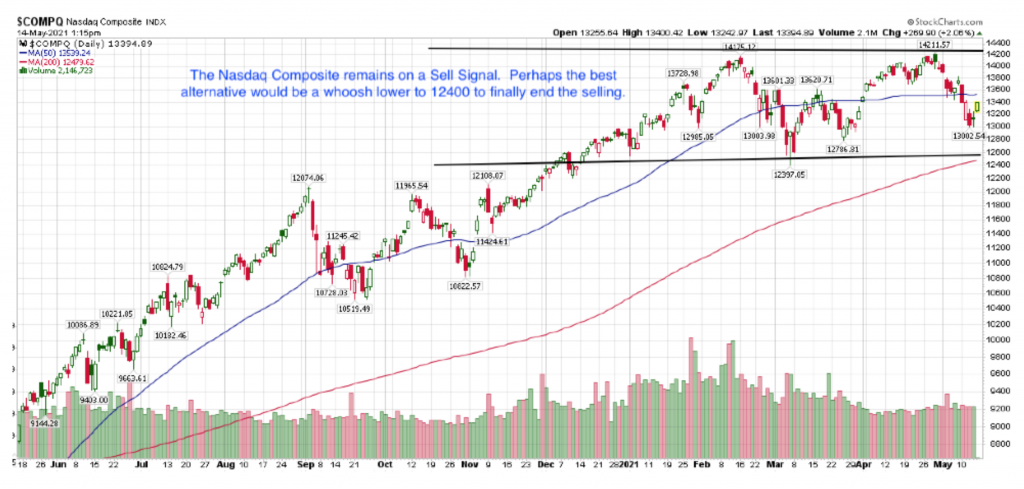
When markets are acting healthy the majority of our gains will come from Growth stocks with the Nasdaq Composite Index. In just this calendar year we’ve had two Sell signals on the Nasdaq. Both Sell signals had meaningful follow through which offers at least some meaningful satisfaction. But I sure would like to see a follow thru rally last for longer than a couple weeks. All in all, this creates a very choppy environment more suited to trading than intermediate termed investing.
vegan investing, socially responsible investing

The cause for the choppy markets has been the rise in interest rates of long term bonds. The bond selloff has been precipitated by a significant boost in commodity prices and inflation plus the Federal Reserve’s current policies. The Fed’s current overly generous policies are more suitable for an economy deep in recession and not for an economy with short term GDP growth of 8%.

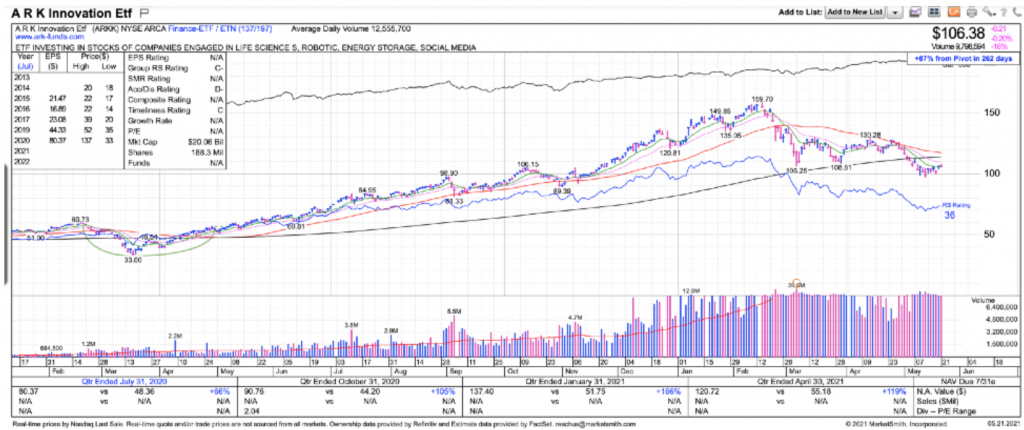
Rising interest rates are toxic for Growth stocks. See the 40% decline in the ARKK Etf which has been a benchmark for ultra Growth companies.
vegan investing, socially responsible investing

A week ago, the inflation and commodity debate appeared to hit a peak with Stanley Druckenmiller’s editorial in the Wall St. Journal and on interviews with CNBC. If you’re not familiar with Mr. Druckenmiller, he is someone worth following. Extremely well- deserved reputation and his opinions appear to have struck a nerve at the Fed.

https://www.cnbc.com/video/2021/05/11/stanley-druckenmiller-fed-policy-criticism-us-economy.html

The current Fed monetary policy as stated by Chairman Powell is to not consider raising short term interest rates for another “31 months”. As I mentioned earlier this stance is inappropriate currently and could lead to a significant long term boost in inflation a’ la 1970s.

Since Mr. Druckenmiller’s editorial two members of the Fed Board of Governors have mentioned the need to address raising short term rates this year. All markets got the message clearly and while its early- it appears long term Treasury bonds and prices have steadied, Growth stocks have halted their decline and may be in the process of turning higher.

While rising interest rates are toxic to Growth stocks, falling or steady interest rates can be a tailwind. It’s early but Growth appears to have put in a bottom and is in the early stages of moving higher.

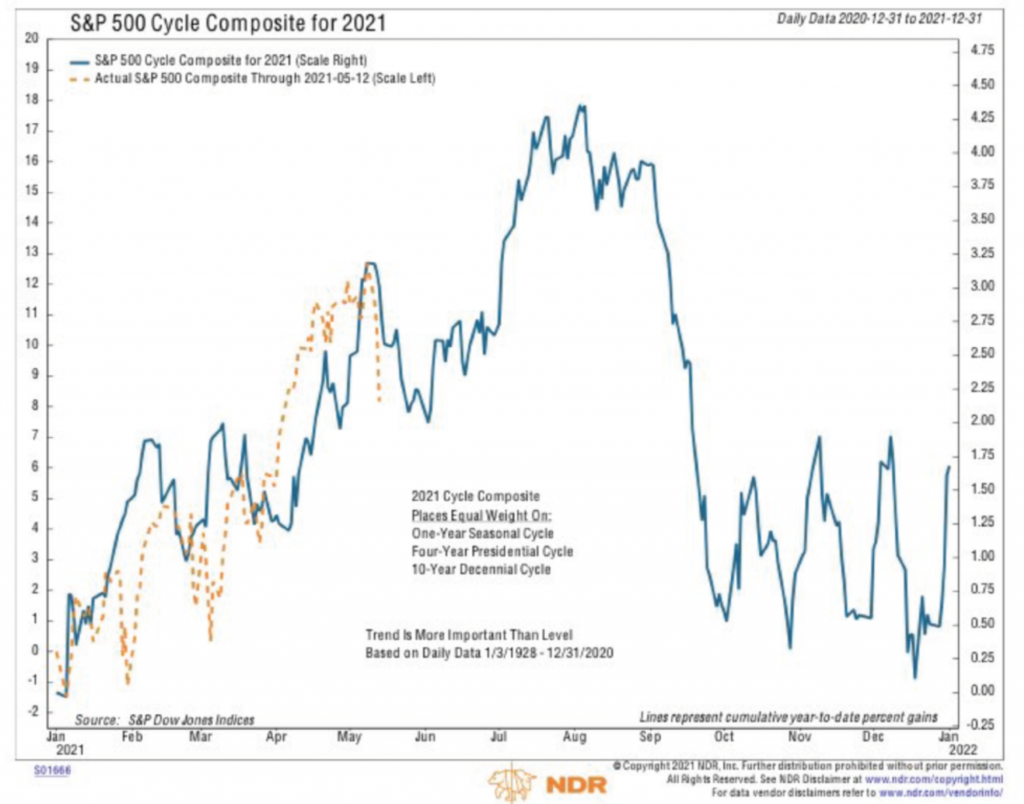
I can’t tell you exactly why cycles tend to work more often than not. But I’ve been following NDR’s cycle research for over 20 years. As the chart shows the Month of May can be rough. Rough markets can generate a great deal of fear and rid the market of complacency. Fear is a necessary factor for markets that bottom and eventually turn and rally.

But looking out to the Fall of this year, markets could make a steep decline based on the chart below. This could coincide with the Fed pulling back from an easy money policy with accompanying bond and mortgage buying.
vegan investing, socially responsible investing


Speaking of fear and its role in investing: Fear is an inverse indicator. Investor sentiment is not accurate to a pin point degree but it is a factor on a weekly to monthly basis.

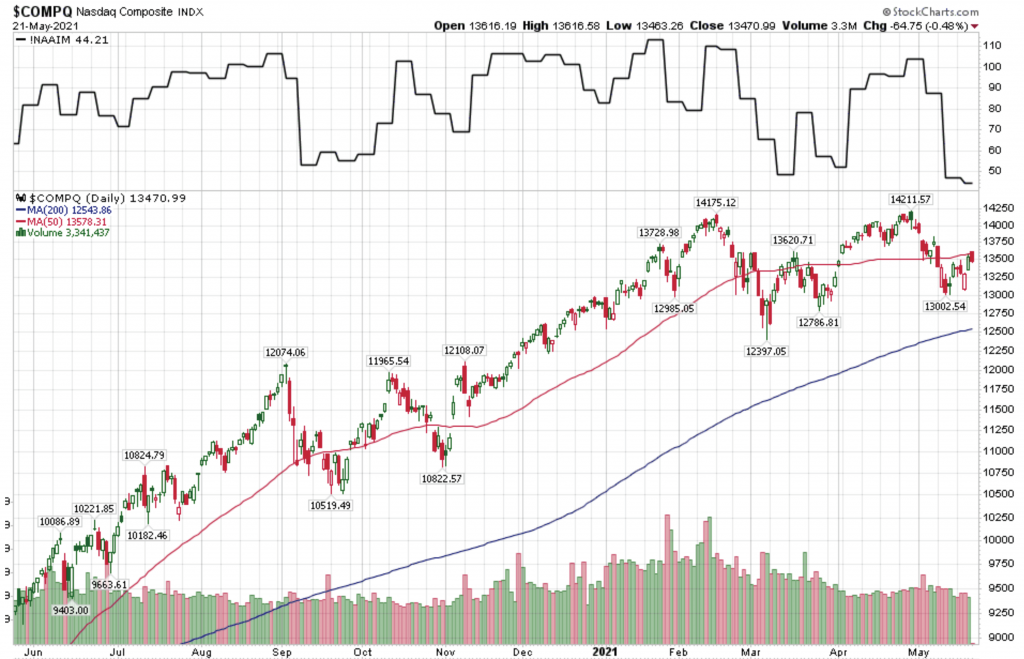
The NAAIM Exposure Index which measures stock market exposure by active money managers is a good inverse tool. I try to do the opposite of whatever their level of exposure is. High exposure is negative and low exposure is positive for stocks.

The NAAIM chart is the top section of the chart below. The members tend to be highly invested at the top and have much lower exposure near market bottom. This is human psychology and behavior repeated over and over again.

Invest up to your eyeballs when confidence is high (which means you’re a market genius) which means you’ve just experienced a good rally. At market bottoms investors are disgusted and afraid. Hence, they chase the inevitable rally.
vegan investing, socially responsible investing

This week the NAAIM data is at 44.21. This is the lowest it’s been since March of last year.

Of course there is no assurance it won’t go lower if more market weakness occurs but its one of the primary reasons I began increasing market exposure to Growth stocks.

Some thoughts about Inflation

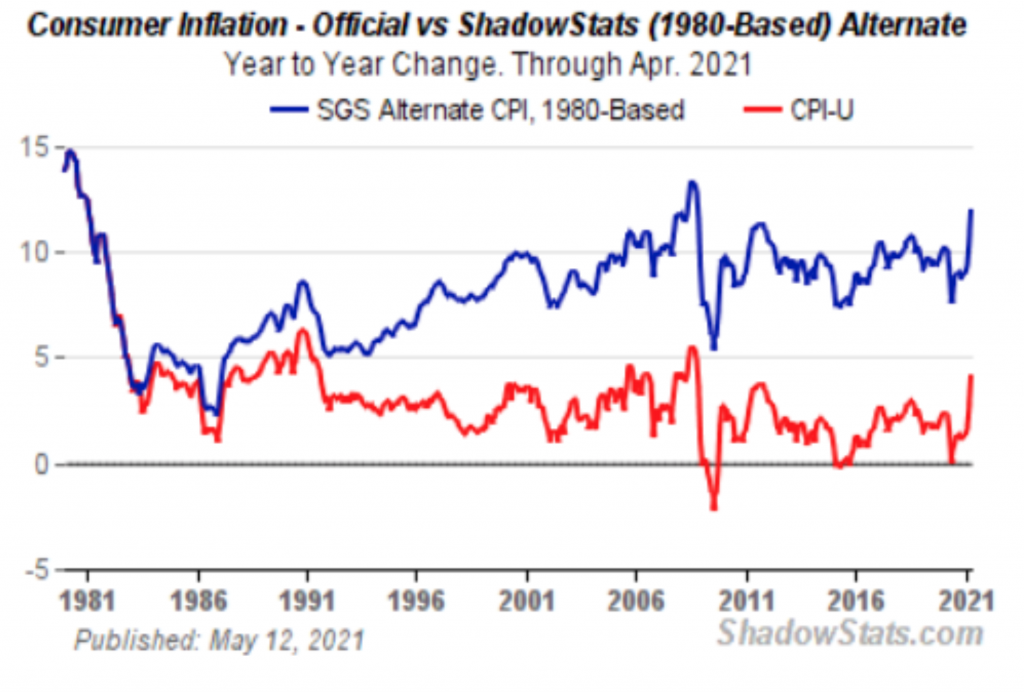
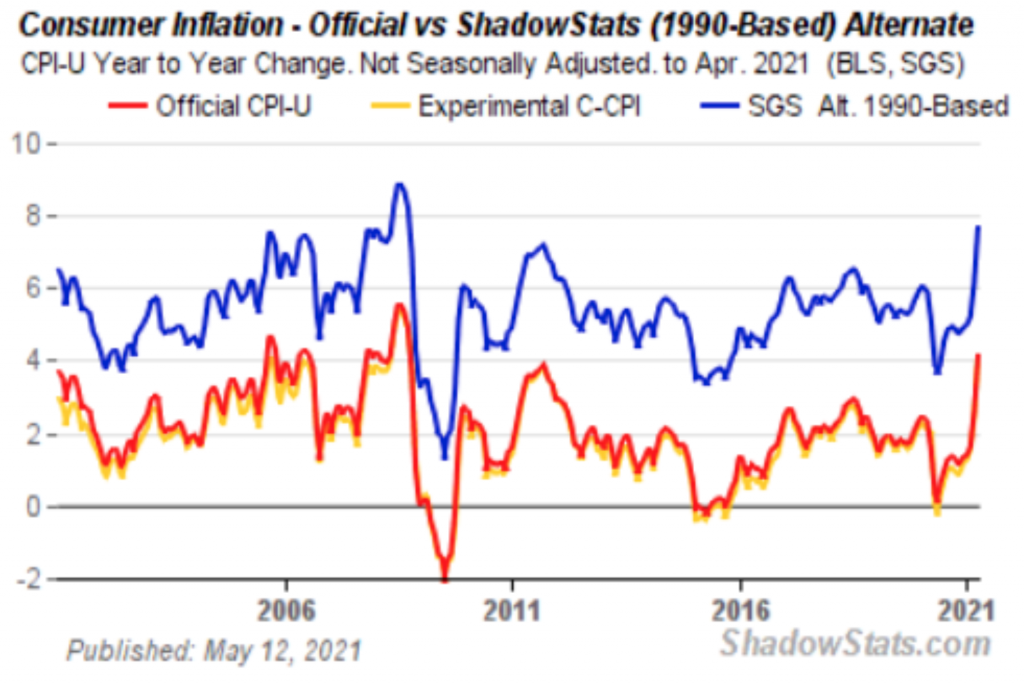
Is the current ramp in Inflation permanent or transitory? IMO Inflation has been with us a long time despite the official government data.

From Shadowstats I’ve posted below Inflation stats based on the 1990 method and by the 1980 method. The Fed has altered the formula for how they calculate inflation to produce a lower level. At minimum this is a conflict of interest for Social Security recipients.

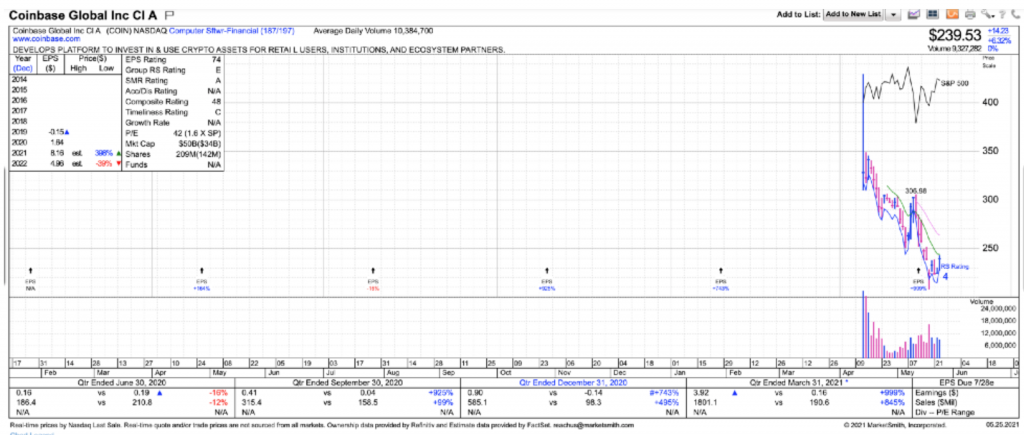
Our positions in Gold, Silver and Coinbase are more of a reflection on the Fed’s debasing the $USD which will lead to inevitable problems. Druckenmiller opines that we could lose our Reserve Currency status within 15 years.

Gold and Silver are obvious choices to hedge against inflation and currency risks. Bitcoin is one as well but its so volatile that by the time you pick your groceries out at the market the price will change by checkout time.

The recent rout in Bitcoin and the inept IPO of Coinbase shares offers an opportunity. While Bitcoins cannot be counterfeited, theres no stopping someone from creating a completely new coin day after day.

By owning Coinbase we don’t need to care about whichever coin is hot this minute. We can own the bitcoin exchange. This is back to owning the hardware store in the 19th century gold mining days rather than mining for the gold.

This morning 5/24 Goldman Sachs upgraded Coinbase with this following note:

Coinbase initiated with a Buy at Goldman Sachs MAY 24, 2021 ‘ 04:56 EDT

Goldman Sachs analyst Will Nance initiated coverage of Coinbase Global with a Buy rating and $306 price target, which represents 36% upside from current share levels. The company offers leverage to an ecosystem that has seen “strong growth” driven by increasing adoption of digital currencies, a leading consumer platform with “strong” customer acquisition trends, an “attractive business model that thrives on elevated cryptocurrency volatility,” and “significant opportunities” to add additional features and capabilities, Nance tells investors in a research note. The analyst sees “significant white space” for Coinbase’s new initiatives to drive more stable and recurring revenue streams.
vegan investing, socially responsible investing

Our average cost for Coinbase is approximately $234.
vegan investing, socially responsible investing

vegan investing, socially responsible investing

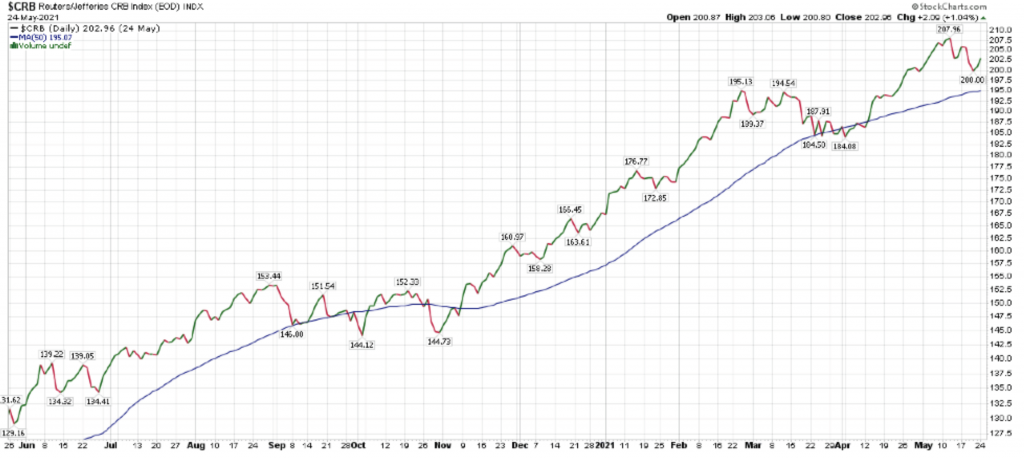
The CRB Index below is produced by the Commodity Research Bureau and is a composite and is a reflection of price trends in commodity markets. Just another way of looking at rising inflation.

One year ago it was 131.62 and stands at 200.87 today.
vegan investing, socially responsible investing

Stanley Druckenmiller’s Op-Ed in the Wall St. Journal titled “The Fed Is Playing With Fire”

The American economy is back to prerecession levels of gross domestic product and the unemployment rate has recovered 70% of the initial pandemic hit in only six months, four times as fast as in a typical recession. Normally at this stage of a recovery, the Fed would be planning its first rate hike. This time the Fed is telling markets that the first hike will happen in 32 months, 2½ years later than normal. In addition, the Fed continues to buy $40 billion a month in mortgages even as housing is clearly running out of supply. And the central bank still isn’t even thinking about ending $120 billion a month of bond purchases.

Not only is the recovery happening at record speed, excesses of fiscal policy are already visible. Consumers are spending like never before, construction is

booming, and labor shortages are ubiquitous, thanks to direct government transfers. Two-thirds of all relief checks were sent after the vaccines were proved effective and the recovery was accelerating. Opportunistic politicians didn’t let the pandemic go to waste. Especially after the Trump years, Congress has decided to satisfy its long list of unmet desires.

Summary:

Investors should anticipate the Fed shifting from an overly accommodative policy to one of more restraint. Until recently this was not a topic of public conversation by the Fed, but it is now.

By no means is this the end of the world for stocks. It just means there is likely to be a sizable pullback when the Fed shifts gear. I would expect this to be in the vicinity of November of this year. But markets will begin to adjust to this change before then.

The NDR cycle chart is potentially an accurate time line of when and what to expect later this year. To be frank, I would really like to have a good sell-off, which I’d hope to avoid. As this would be “the Pause that refreshes”.

In the meantime we may be moving past peak-inflation which is why Treasury bonds prices have turned up. In turn, this is causing Growth stocks to rally.

A normalization of interest rates could likely mean a return to the value of Active Management. Active managers with effective systems can potentially avoid sharp sell-offs that would leave Index investors exposed.

Thank you,
Brad Pappas
May 25, 2021
Vegan Humane Investing