“Nothing but blue skies ahead”
National Trade Council Director Peter Navarro
– June 25th, 2018
July 1, 2018
Summary: Last month I wrote about the Fed and what I expected could happen by the end of 2018 or early next year. My timing last month was too optimistic as things are coming to a head now. I expect the 3rd quarter to be volatile with a downward bias as the Fed and the European Central Banks (ECB) continue to destroy their economies and markets with policy errors.
The world’s stock markets are in the process of crashing. It’s naive to think that the ripple effect will not happen here. Unless the Fed states that they’re going to pause raising interest rates or halting QT (see below), we can expect a market sell-off in the 15% range. This may be one of the reasons Trump tweeted that he asked the Saudis to increase oil production. There isn’t much inflation in the system right now except for energy prices. By increasing production with the hope of lowering the price of oil, it may be enough reason to for the Fed to halt rate hikes. But we really don’t know what the Fed will do at this point.
At the start of last week, we had three big issues to contend with.
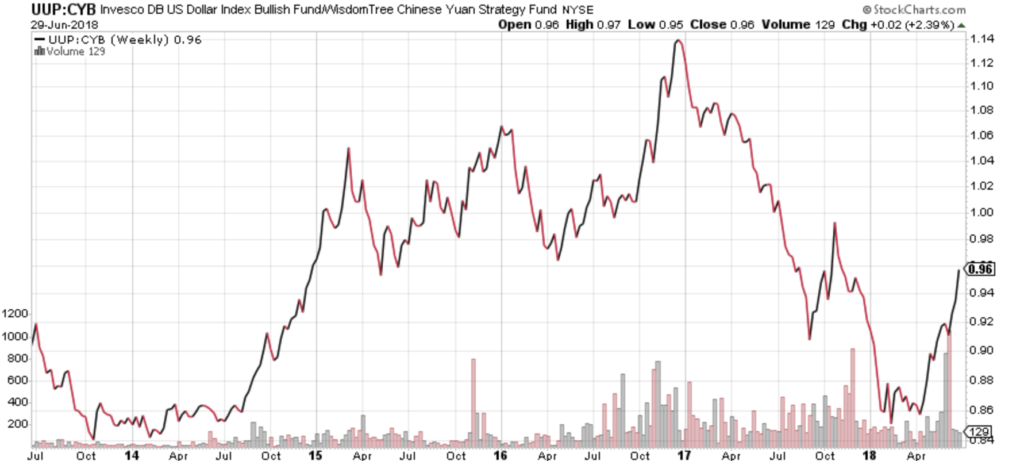
1) The rapid rise of the U.S. Dollar (USD) versus the Chinese Yuan.
China does manipulate their currency against the U.S. as detailed in the chart below. Spikes in the USD/Yuan valuation in recent years have been catalysts for dramatic sell-offs in U.S. stocks. Part of the problem is, in a world starved for short term yield, money is now being converting to USD to buy short term yields. In addition, the effect of QT (See below #3) is also a cause for the increase in demand for USD to buy Treasuries. Regardless of the reason, the devaluation of Chinese Yuan negates much of the tariff risk to China while also having a negative effect on the U.S. economy as U.S. goods become more expensive. Add tariffs to the mix and you can expect a significant slowdown in U.S. growth soon.
The rise of the USD – caused by the Fed raising short term interest rates and investors liquidating short and intermediate term bonds – is causing Emerging Markets (EEM) to crash. The break below the EEM’s primary moving averages occurred at the same time the Fed most recently raised interest rates.
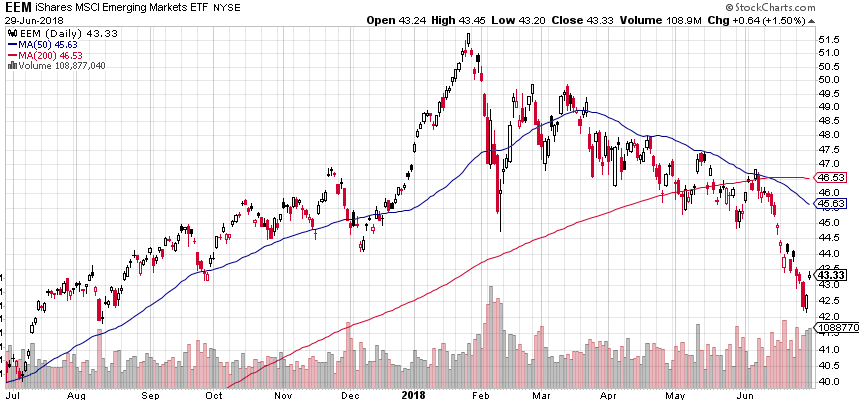
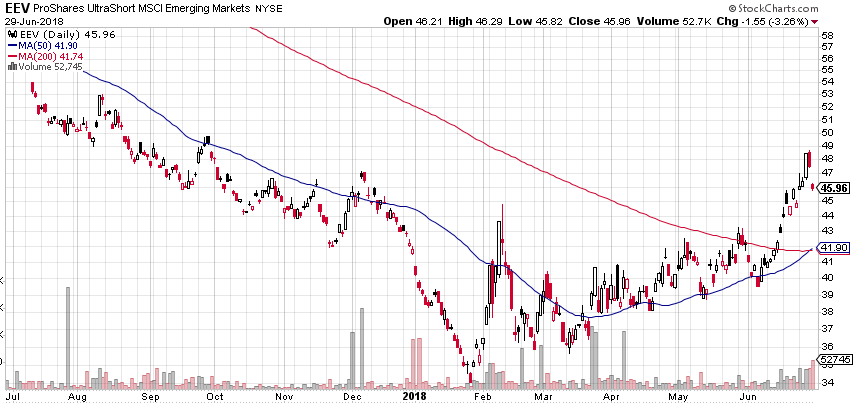
I had been watching the EEM exchange traded fund (ETF) along with its inverse ETF which rises as the EEM declines. We were able to make initial purchases in the $41-$43 zone. See below. I am using the EEV as a hedge against our current stock holdings.
This is how the world’s regional markets are reacting to Fed and ECB policies:
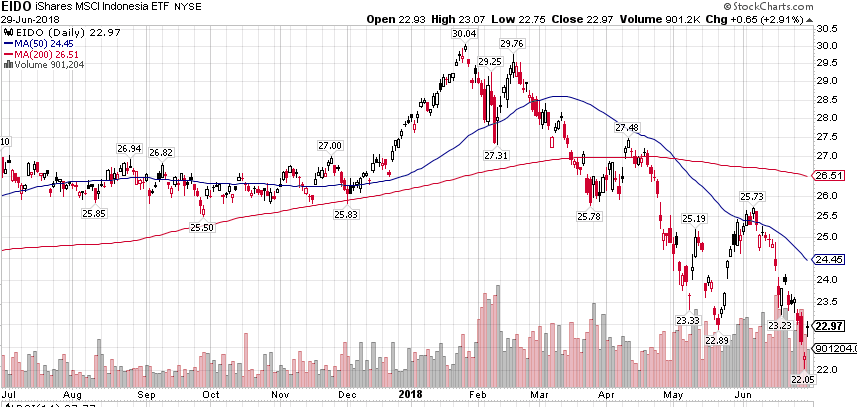
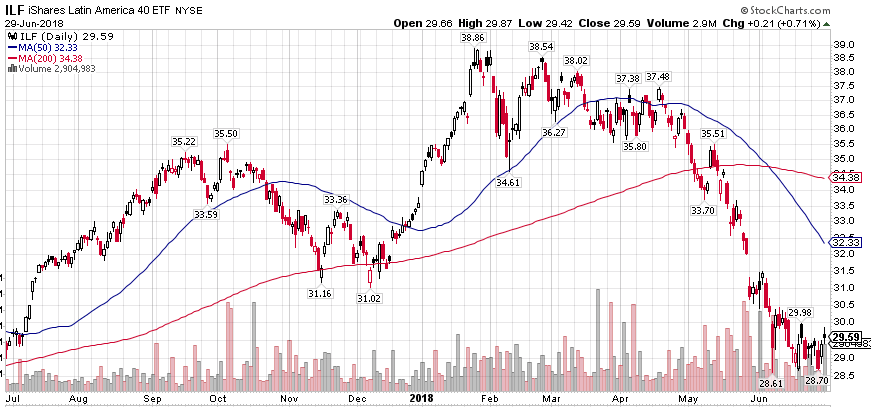
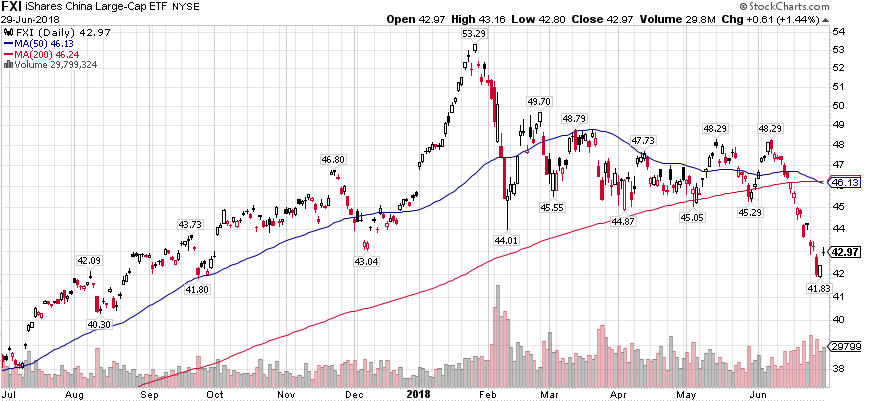
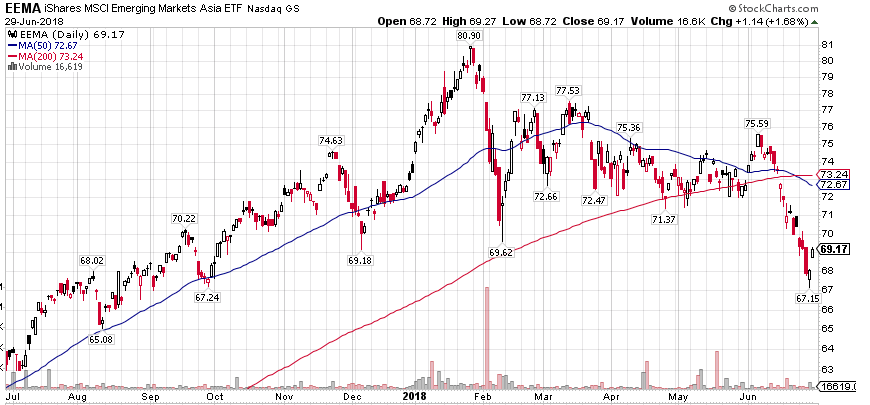
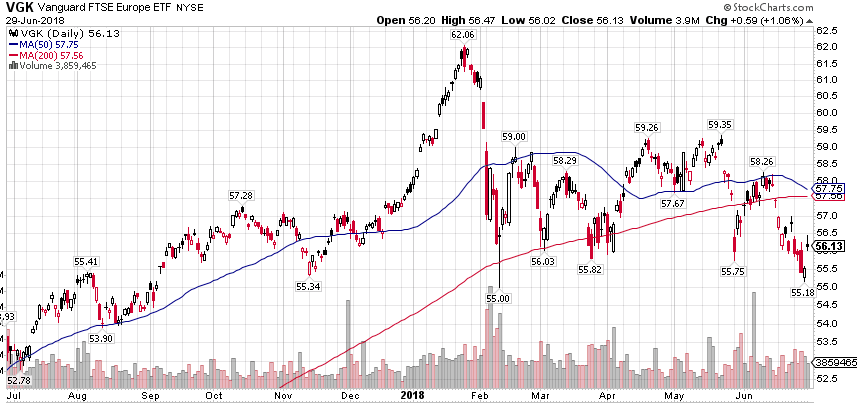
All of these international charts are in the Bear Market zone.
2) The Yield Curve
The Yield Curve continues to decline and, unless the Fed stops raising short term interest rates, it should cross below the 0 threshold which will signal an incoming recession. For more on this click on the following link.
https://www.federalreserve.gov/econres/notes/feds-notes/predicting-recession-probabilities-using-the-slope-of-the-yield-curve-20180301.htm
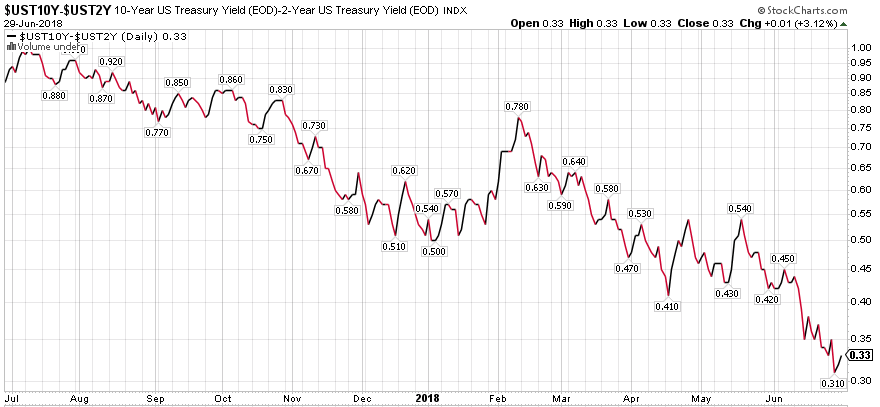
In the chart above, the closer the Yield Curve gets to zero, the more nervous investors will become.
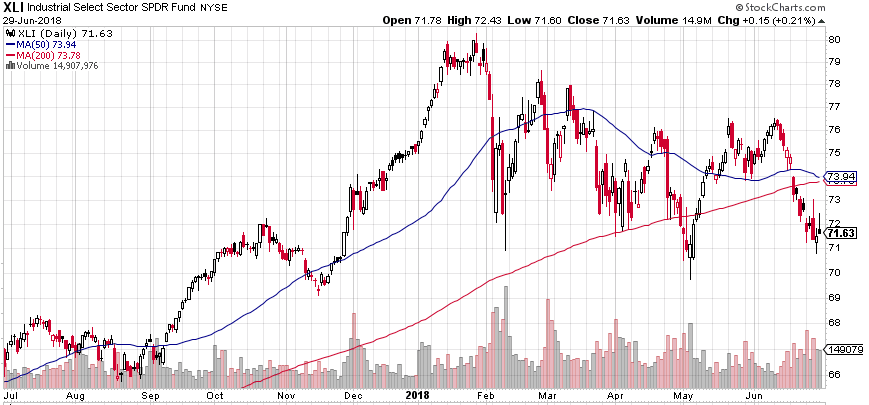
The studies show the recession could be as long as a year or two following an inverted yield curve. But stocks move in anticipation of the future, and the Financial and Industrial stocks in the U.S. are moving into Bear Markets. We don’t need another banking crisis but that exactly what the banks are showing. Just brilliant timing by Congress to eliminate many of the restrictions after the 2008 debacle.
The industrials have to contend with both trade wars and the Fed raising rates. They’re signaling that our present GDP growth is coming to a hard stop unless the Fed stops their behavior.
High Yield Bonds – otherwise known as Junk bonds – can act like an early warning signal as they are a reflection of the risk in credit markets. If Junk bonds are selling off and Treasury bonds are rallying, that tells us there is trouble brewing as money exits risky credit for safe credit.
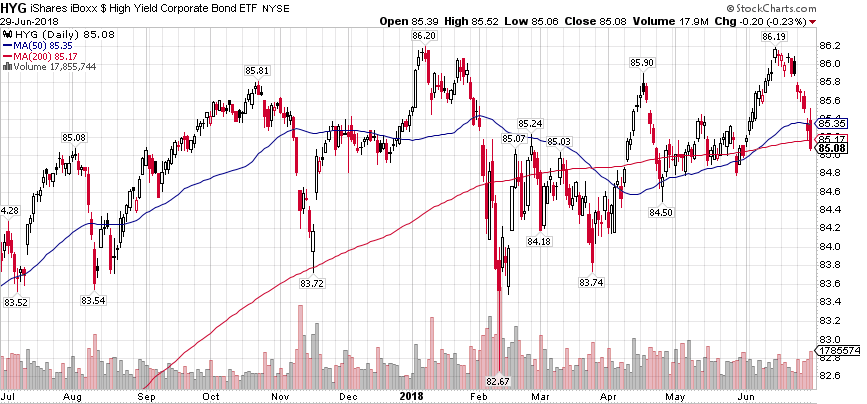
High Yield is on the verge of signaling that credit markets could be become increasingly concerned about risk.
3) Quantitative Tightening (QT)
Lastly we have QT. QT is the inverse of QE known as Quantitative Easing. After the collapse in 2008, the Fed and the ECB went on a series of actions (QE) whereby the Fed bought huge amounts of Treasury bonds in an effort to lower interest rates making stocks, treasuries, real estate etc… more attractive. In doing so, they created huge wealth for those who owned risk- oriented assets. However, the downside is that the Fed now owns a huge inventory of bonds and other securities and they have mandated that they must now begin selling off their inventory to “reduce their balance sheet”.
The liquidation on the open market by the Fed and the ECB is known as QT or Quantitative Tightening. When a central bank sells a security on the open market, the buyer is giving cash to the Fed in exchange for the security. On a mass scale, this reduces the amount of cash or USD in the system.
The primary driving force in the stock market is the ebb and flow of cash in our economy, otherwise known as liquidity. When cash is coming into the system, it makes its way into the markets and drives prices higher. The inverse is also true but we’ve never actually experienced QT before. It could be a disaster on its own. But combined with rising short term interest rates, it could be lethal to the buy-and-hold long term investor.
I’ve shown many charts that show the deterioration of the markets in the U.S. and abroad. In June, the Fed was selling off $30 billion in inventory a month and look at how much damage that created.
Come this month (July), the Fed and the ECB will both be enacting QT. The Fed is scheduled to raise the amount of liquidation from $30 billion a month to $50 billion.
Summarizing
I believe the Fed’s attempt to normalize interest rates is failing. My guess is that, at some point, the Fed will stop but the question is how much further damage will be done before they signal a white flag.
In the past two weeks, I’ve reduced our clients’ risk exposure greatly by adding inverse exchanged traded funds and adding Treasury bonds. Treasury bond prices should rally quite nicely if the Fed continues on its course of action as money moves to safety.
Should there be further weakness in the S&P 500, I’d like to add inverse ETF’s based on the SP 500 as well. A break below 2670 would potentially signal a much further decline ahead.
If you’re a new investor or have capital you’d like to add, this could be an opportunity for you, especially if we have a steep decline and the Fed backs off from rate hikes.
What else could happen? The Chairman of the Fed is Jerome Powell and he will be under intense pressure to stop their present course. Pressure is not surprisingly coming from the White House as well as the Fed is a threat to kill the Presidents economic agenda.
If Powell signals that the Fed is done with raising rates then a move to 3000 in the S&P 500 and a sharp sell off in long term treasury bonds is not impossible. Stay tuned. But my guess is there will be considerable damage done first.
Powell was appointed by Trump and it’s my understanding he can be fired as well. A firing would be considered a major positive event for risk markets.
Time will tell and this period will pass as well. It’s a time to be very cautious and hedged against risk.
We are positioned to protect our client accounts and benefit if a major decline occurs.
The irony of all of this is I didn’t even mention Trade Wars. But they’re easy to win so it’s all good.
Brad Pappas
Adapt, Evolve and Prosper
6/5/2018
One of the constant questions I ask myself is “Where are we in the business cycle? And, how much time does it have left?” Employment and GDP growth look great now and, as humans with a positive attitude, we’re inclined to think the good news will continue indefinitely. But the problem we have at this late stage in the cycle is the Federal Reserve will soon be raising rates to the point where they will be generating a great deal of pain to the economy. As sure as the sun will rise in the morning, the Fed will push the economy into recession.
The rising stock market acts like a slight of the hand trick distracting us with strong momentum and keeping our attention away from the Treasury bond market. The continuing shrinkage between the yields of the 2 and 10 year Treasury bonds are telling us that we are soon to be at the peak of the business cycle. There is no immediate danger right now as risk assets like stocks, commodities, real estate and crypto’s could have another 6 to 9 months to run higher.
For those of you who are new or have never experienced a cycle peak as an investor, I’m not talking about an ordinary garden-variety market pullback but something on the order of 3x to 4x of the January decline. These cycle peaks are not to be ignored as risk assets are frequently crushed.
I realize this sounds ghoulish and fearful but it’s real. To be frank, from the investment point of view, it’s the necessary transition from an old Bull Market to a new Bull that can last for years. The fulcrum point which could tilt the balance from stocks to bonds will be handled with care as my goal is to continue the growth curve of your accounts by adapting to a changing environment.
As I’ve mentioned in previous letters, I may anticipate a major move in an asset class but I want to see price confirm my suspicion before I act in force. Many an investor goes broke trying to predict what may happen; I prefer to wait until price confirms my thesis.
The best investors in the world have the ability to adapt and conform to whatever environment they face. Passive Indexing, Buy and Hold strategies and those not paying attention are reliant on a rising Bull Market for gains. That’s not the case with RMHI. As an active manager on your behalf, I look at recessions as an opportunity and will reconstruct your investment portfolios to prosper in the coming Bear Market.
A business expansion period can last for most of a decade. In contrast, the cycle peak-to- trough is usually about a year. In other words, risk assets fall a heckuva lot faster than they rise.
There hasn’t been much to say recently as the markets chop up and down with modest net progress. Long term trends for stocks remain positive but there are new signs of life in Treasury Bonds. Everyone, including myself, was looking for higher interest rates in January but I believe that moves to higher rates are over and a reversal to lower rates is emerging. The move to lower rates has likely been magnified by Italy but the closing gap between the 2-year Treasury Bond and the 10-year has been an ongoing trend.
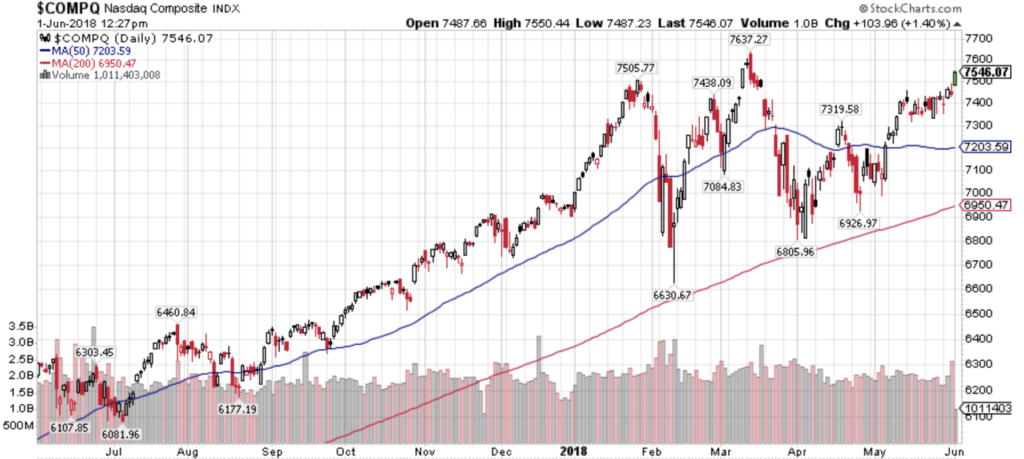
The Nasdaq Composite Index remains the strongest market index as it contains the highest percentage of the best growth companies. In addition, today (June 1) the Nasdaq is breaking out of its May trading range and could be the first of the major indices to reclaim the January peak. So I’m maintaining a higher than average percentage of client assets in Technology as it remains one of the strongest industries (aside from Oil and Gas which of course we don’t touch).
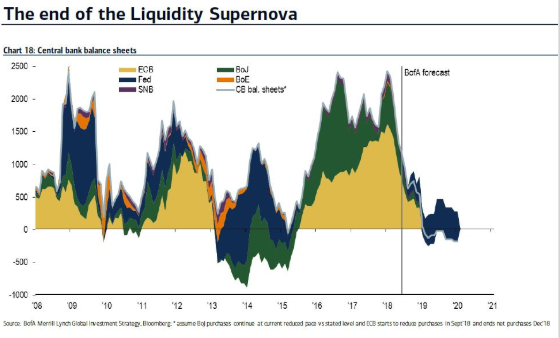
The focus of this client letter is the price behavior in Treasury Bonds and the impact of the world’s Central Banks shifting their policies from pro-growth to restrictive. They’ll likely be very problematic for the economy and stocks in six months to a year.
As the chart below reveals, the world’s central banks are acting in unison. By 2019, the world central banks will be initiating a global slowdown in growth.
Its quite possible that the reversal in Treasury bond prices is a nascent trend that could bring interest rates much lower which in turn would trigger the infamous “Inverted Yield Curve” (IYC). The IYC is a wonkish term to mean that short term interest rates are higher than long term interest rates. IYCs have an impact on consumers since it forces those with adjustable rate mortgages to pay more than fixed rate. The same holds true with lines of credit.
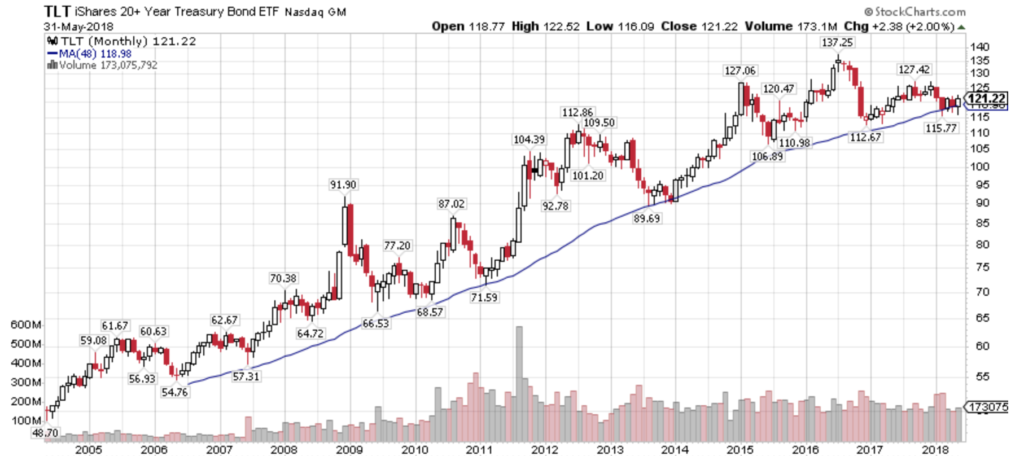
This chart above is a long term chart that does a nice job of revealing the long term trend in long term bonds. The blue line is a 48 month moving average and it conforms to the upward trend. But this month the price of long term Treasury Bonds jumped 2% and is right on the trend line which tells me that all the talk of rising rates is probably wrong.
Plus, given the trends in the Yield Curve which are becoming more ominous, there is a very good chance we’ll begin to buy long term Treasury Bonds in anticipation of a weaker stock market and recession in 2019 and 2020.
It’s a cold truth that every Bull Market will be killed by the Federal Reserve and that includes the Bull Market that exists today, which leads us to this point in time.
Yield Curve Making New Lows
The next chart is a graph of the “Yield Curve”. Its a common occurrence that before recession induced bear markets, the Yield Curve inverts. The Yield Curve has inverted ahead of every recession in the past 40 years. How much money and grief would investors save just by tracking this bit of data?
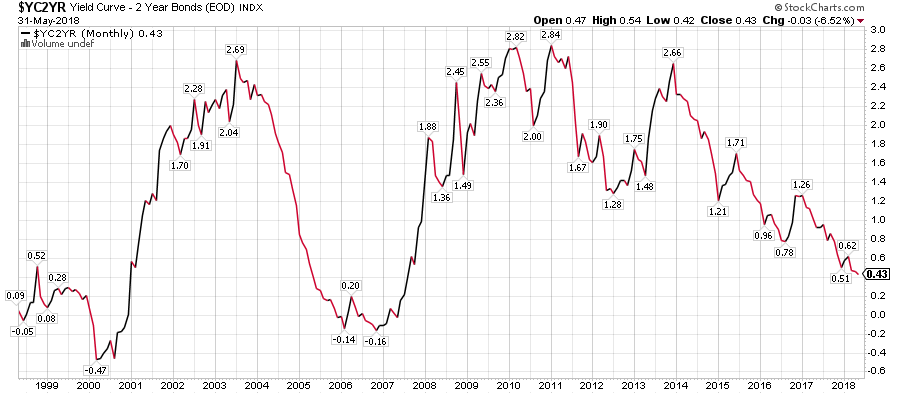
The Yield Curve is calculated by subtracting the yield of the 2 year Treasury Note from the yield of the 10 year Treasury Bond. Today its 2.83% – 2.40% = .43% as seen in the chart below. Look on the chart above to see how the Yield Curve behaved in 1998-1999 and 2006-2007. By the time the curve turns upward, it’s too late as the damage will be done and the Fed will try to reverse course.
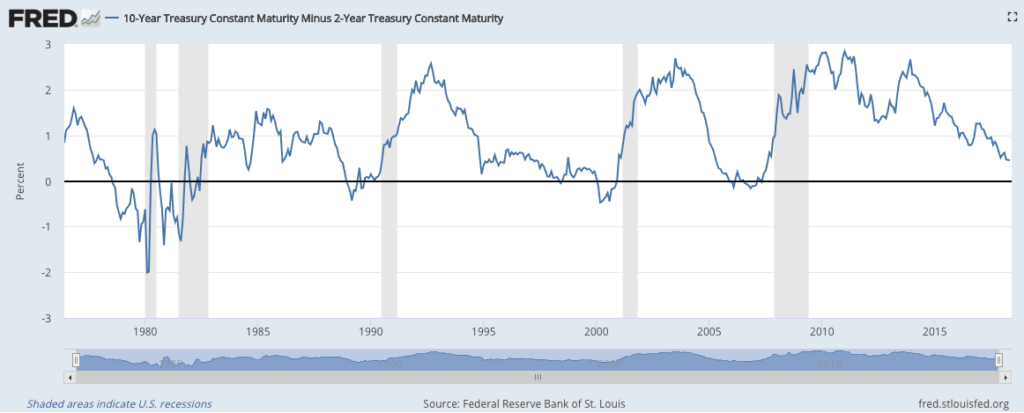
US Monetary Policy is the primary reason we have Bull Markets and Bear Markets for almost every asset class. As the chart above reveals an inverted yield curve has been an excellent forecaster of incoming recessions.
There is a lag time of 6 to 24 months between inversion and recession and we can’t be fooled into thinking “this time it’s different” that a recession won’t occur.
The yield on the 2-year Treasury Note is based on the Federal Funds rate which is controlled by the Federal Reserve. See chart below. The Fed is stair stepping rates higher and has plans to raise rates by .25% two more times this year. Assuming the 10-year Treasury Bond yield stays put, those rate hikes could cut the margin by .50 and down to -.05% (Yield Curve Inversion).
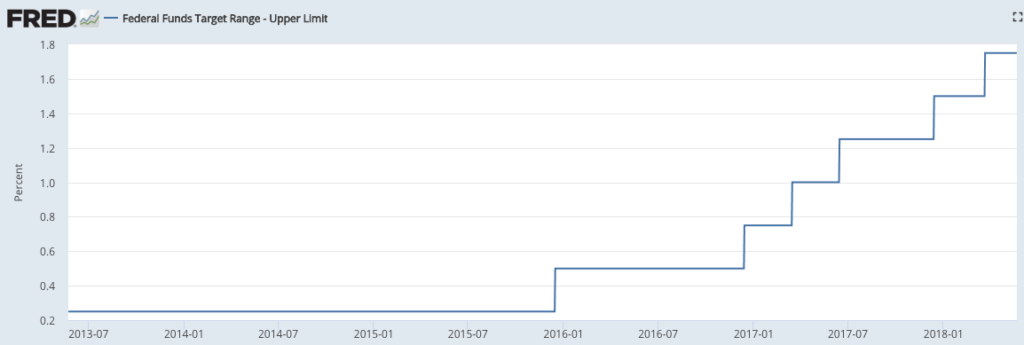
When the yield on the 10-year Treasury and the 2-year T-note are equal or inverted it becomes a giant alarm to run and not walk to the stock market exit. During this period we will sharply reduce are stock holdings to pare down risk. In the past 3 months we’ve head a series of declines in the S&P 500 Index which stopped right on the 200-day moving average (DMA). In a Bull Market we may hedge against the index falling below the 200 DMA but the odds are not very good for major break below.
When monetary policy (meaning the Fed hiking rates) becomes very aggressive, as might be the case in 2019, I would expect a decline back to the 200 DMA followed eventually by a major break below the average and an additional decline of 25% to 40%. This sharp break below the 200 DMA is the trigger point for me to increase exposure to Bear Market related strategies and keep our stock holdings to a minimum.
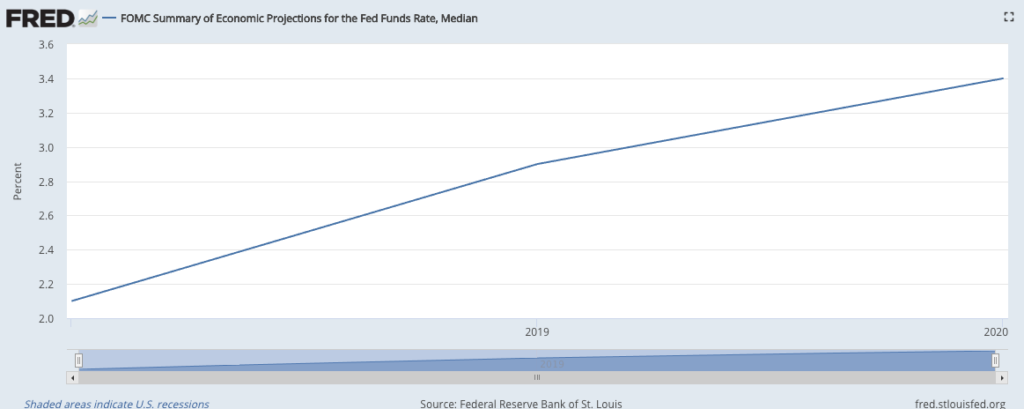
This next chart below, produced by the St. Louis Federal Reserve, is their own projection of where the Fed Funds rate might be in 2019. They’re projecting the Fed Funds to be a 3.4% late in the year which is well above the current yield of the 10 year Treasury bond of 2.83%.
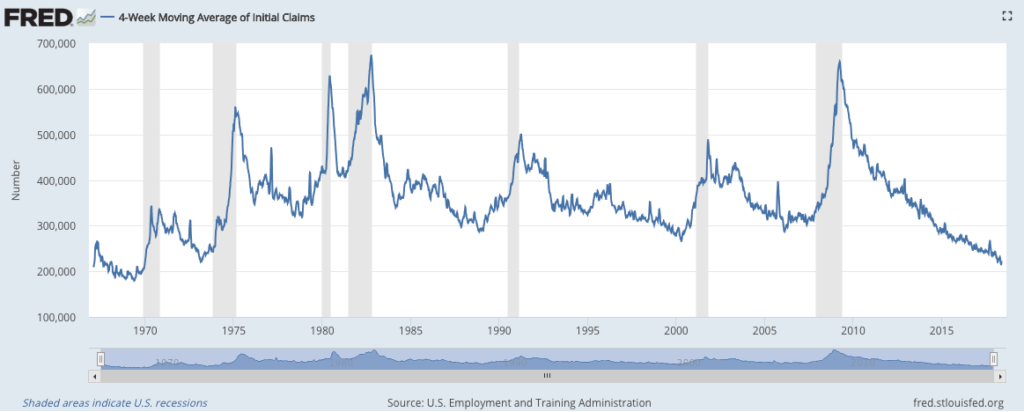
On the bright side, and there is a bright side at least for the time being: Employment.
Historically, unemployment claims start to rise at least 7 months before a recession and there’s no sign of that now as the chart below illustrates.
Summary: The present data is supportive of a continued market rally in equities and of economic expansion. But looking six months ahead there is concern that we could be dealing with a stock market and business cycle peak. We’ll be prepared to shift from Bull Market positioning to Bear Market strategies in all portfolios. The primary trigger will be a decisive move below the S&P 500 200-day moving average. In the meantime, enjoy the summer and the next leg of the rally.
Thank you,
Brad Pappas
We’ve updated our Vegan Growth Portfolio model results with the data through June 1. The VGP is up a bit since May 1 and remains well ahead of the S&P 500.
Access our VGP Model Data
We’ve updated our Vegan Growth Portfolio model results with the data through May 1. VGP is still well ahead of the S&P 500.
Access our VGP Model Data
Recently I’ve seen a few studies and charts on Twitter that lend favor to Tax Efficient Investing. These are portfolios where each holding is designed to be held for more than one year. This stragegy allows them to qualify for reduced taxes as a Long Term Capital Gain. The articles I’ve seen generally advocated by financial planners and advisors who see Tax Efficient Investing as their way to add value or have an edge for the clients of their practice. But not once have I seen a credible article playing the role of Devil’s Advocate for Tax Efficient Portfolios. Today the Dow Jones Index was down 660 points at mid-day. It would seem apropos to highlight a few of the disadvantages of Tax Efficient Investing.
The points I will make are from the perspective of a Growth-oriented investment advisor whose primary investment vehicles are stocks, ETF’s and ETN’s. Municipal bonds are a different animal altogether and not the subject of this blog post.
Are the lower taxes worth the losses?
The primary objective of Tax Efficient Investing is to own an investment for at least 12 months. Our primary objection to this strategy is prioritizing time of ownership over gains. Investment gains can disappear or be significantly reduced by the goal of hanging on for one year. For example, you buy a stock at $50 on January 1, 2017 and perhaps by April 2017 the stock is $65. But by January 2, 2018 the stock could be anywhere. A major sin of investing that you open yourself up to is not taking the gain in April. If the market goes into a sell-off where the stock goes back to $50 or below, your gain has been negated. It reminds me a bit of the game show “Let’s Make A Deal” with Monty Hall. Monty would offer a contestant a sure deal right off the bat, but with the caveat of “Would you be willing to give up the sure deal for whats behind Door 1”. It could be a brand new living room or dinette set (hey I watched it in the 1970’s). It could also be a rusting bucket of used auto parts. At that point Monty would offer the bizarrely dressed contestant the consolation prize of the home version of the game show. Cue sad trombone.
The stock could also have gone to $75 in good market as well, up 50%. If the stock continues to rise without any major setbacks, an experienced Trend Following methodology as well as a Tax Efficient investor would likely continue holding on to the stock. There is a primary difference between a Trend Following system – which we employ – versus a Tax Efficient strategy. We’d take a profit should the stock decline below important benchmarks. Declines below certain sell points raise the question of whether the stock is even in an uptrend. By the way, how hard it is to find a stock that can smoothly rise throughout the entire year? This means the company must produce 4 good earnings reports in a row and not sustain large pullback. 2017 was an easy year for Trend Followers. Even then almost 95% of the stocks we bought could not sustain 12 months of positive performance.
Are the drawdowns tolerable?
In point 1 I discuss a scenario of a single stock. But if Tax Efficiency is the goal along with long term Growth, you can now envision how volatile that portfolio would become. By not exerting proper risk controls, the portfolio would likely have longer and more significant drawdowns. Is that something you really want? Most investors, especially those who are new to investing cannot endure declines of 30% or more to their portfolios. This begs to ask: “Would you pay a bit more in taxes for less volatility?” In my experience which is based on client retention, the answer is “yes”. People hate losing money more than paying higher taxes.
What about lagging holdings?
Digging down deeper into portfolio management is the issue of what to do with lagging holdings. A lagging holding is the stock that you have had a gain on, but is now going nowhere. Our view is to sell laggards in a rising market. We don’t see the value of holding an investment unless its producing for you. A major advantage to this is to look for new potential winners. But the Tax Efficient portfolio may hang on to the stock till it clears the one-year hurdle. This is another factor contributing to underperforming portfolios.
To sum it up: Tax Efficient Investing can be a proper strategy for some investors but for most it isn’t. Investment methods must not just make financial sense. The methods must also be cognizant of the investor’s risk profile and emotional impact. One size does not fit all and every investment method has some inherent weaknesses. Most investors would probably feel more comfortable knowing the achilles heel of any strategy.
Cheers,
Brad Pappas
We’ve updated our Vegan Growth Portfolio model results with the end-of-year data. Check it out as we had a great 2017! Access our VGP Model Data
Happy New Year and our best wishes for 2018 as well. New client letter forthcoming, stay tuned.