Euphoria in the air
12/15/17
Quick Summary: So much for the consensus opinion of being in a “low return environment”. November was a terrific month that brought back some memories of 1999 when Tech stocks rocked higher every day. In my opinion there was a bit of euphoria in the air as so many of our stocks either went parabolic or increased their angle of ascent above 45 degrees.
There is the potential that we will see a shift in stock sectors in 2018 from Growth to Value but it’s really too early to tell. Since mid-November it seems all the sectors and groups that lagged this year are playing catch up while the winners move sideways.
Odds of a recession starting in 2018 are very low and most data points to healthy growth once again for the coming year. The Fed will be stepping up their rate hikes in 2018 which is giving traction to Treasury bonds and I’m focused to see if any rise in the price of Treasuries accelerates. If that’s the case then Treasuries will be essential in 2018.
As I can tell there are two points of concern coming into 2018: Investment sentiment is too high. This sets the stage for a reversal and correction at some point next year. The bull market will be another year older which increases the chance for pullback in 2018. The Bitcoin craze is an example nutty hysteria as there are now stories of people mortgaging their homes to buy more crypto currencies.
The second concern is the status of the North Korean issue. Markets have been very calm in the face of the tension as the largest institutional investors believe some deal or Treaty will eventually evolve.
Growth versus Value
Growth Stocks have had a great year relative to Value stocks in the last year. But recently Growth has broken its upside trend line as it declined sharply relative to Value. Markets never make it easy for anyone and those who think just owning Amazon, Facebook and Google constitutes a good “buy once and forget” may find their portfolio adrift going nowhere next year.
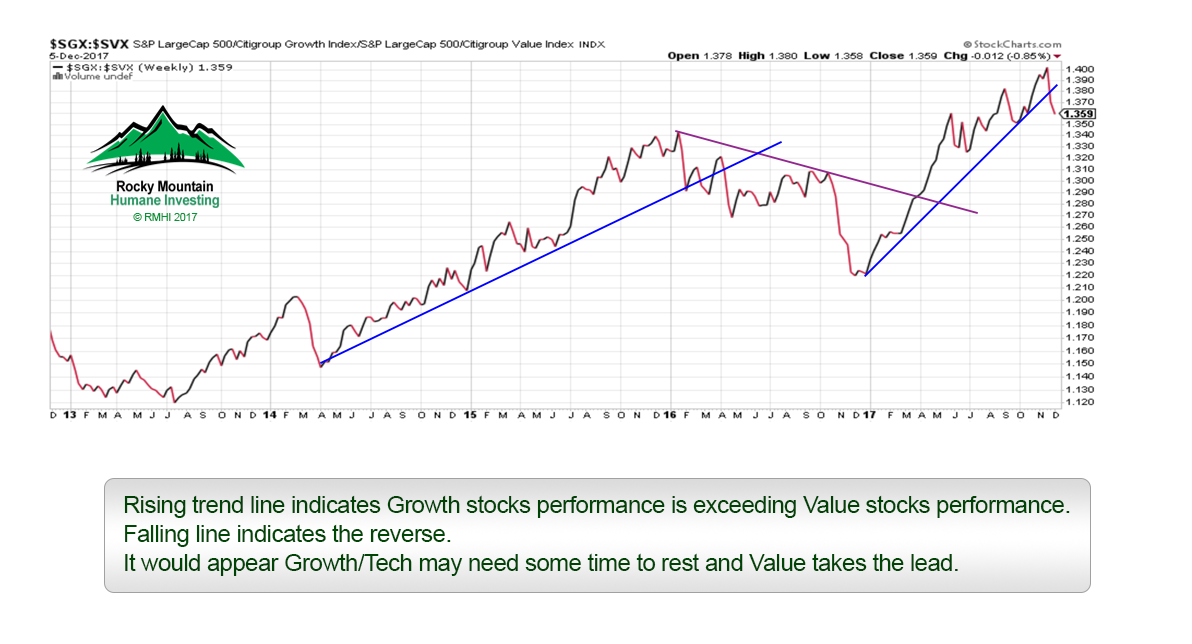
Tech stocks have not given up their leadership completely just yet but I’ve moved to a more balanced industry portfolio spread across more industries this month.
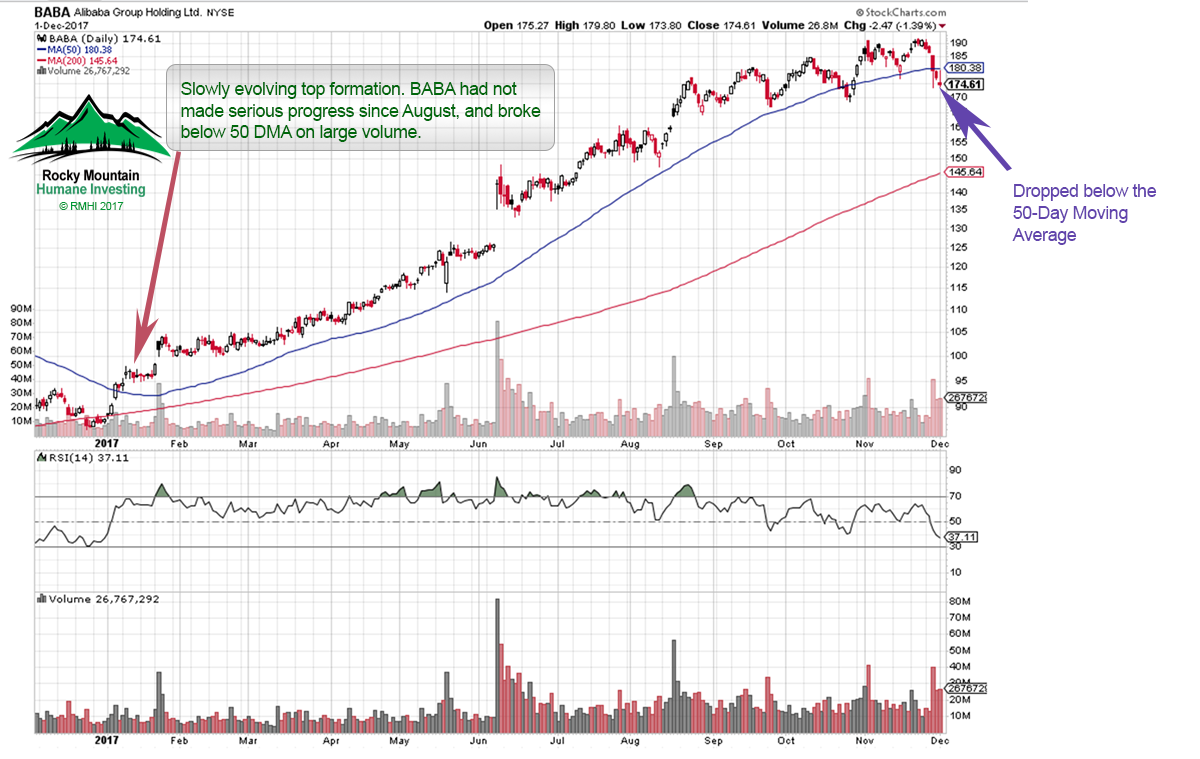
Our biggest winner of the year was symbol “BABA” Alibaba Group Holdings which we bought in January and sold recently. The chart shows how BABA shares have made little progress since August despite a very strong Nasdaq. The stock is showing signs of distribution as large investors started selling in early November. Recently it broke through its 50 day moving average. Investors seem reluctant to defend the stock on any selling so we took our profit.
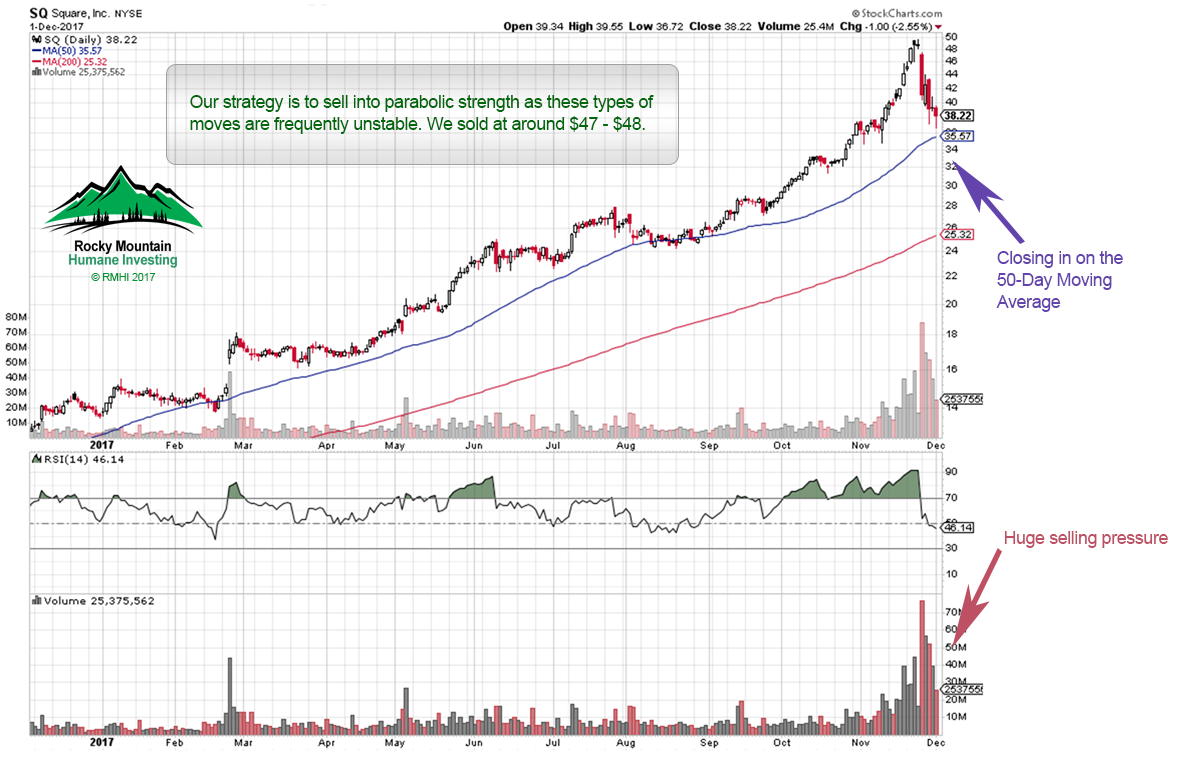
I do have a rule regarding investments that move higher to a parabolic degree. Parabolic moves are unstable and prone to sharp reversals. This was the case with Square which was another good winner this year. But the stock turned on its booster and went parabolic in early November and we sold in the $46-$48.
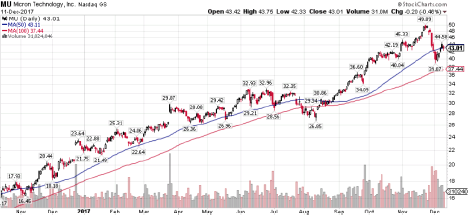
One of our losing positions in November was Micron Technology which we bought in the $48 range and sold at $40. While it has since rebounded a bit I’m still very suspicious about the near term of Semiconductor stocks as they’ve had a great run.
Nothing since the crazy Dutch Tulip Bulb craze have we seen anything like Bitcoin. If Bitcoin does collapse from its parabolic hysteria the losses could be epic. I must be the only person who has ever been stopped out of GBTC but the problem is that Bitcoin trades 24 hours a day. This means that stop loss orders on the Nasdaq for GBTC could be almost worthless in keeping losses small. We could have a stop loss order to keep a loss at 5% on the Nasdaq but since Bitcoin trades 24 hours a day the opening price for GBTC could many multiples of 5% up or down. With undefined risk I won’t trade it.
That’s it for now. I wish you all the best of the holidays and a prosperous 2018.
Brad Pappas Brad@greeninvestment.com

Five years ago we created a series of portfolios, including our Vegan Growth Portfolio, on a website platform that was new for us: Collective2.com. We wanted an objective and independent 3rd party platform that would reflect client transactions returns and factor in all trading and management expenses. A credible 3rd party platform was critical as we’re always suspicious of trading systems or managers with in-house platforms.
The Vegan Growth Portfolio when fully invested will have 25-30 holdings and is suitable for retirement accounts and long term growth investors.
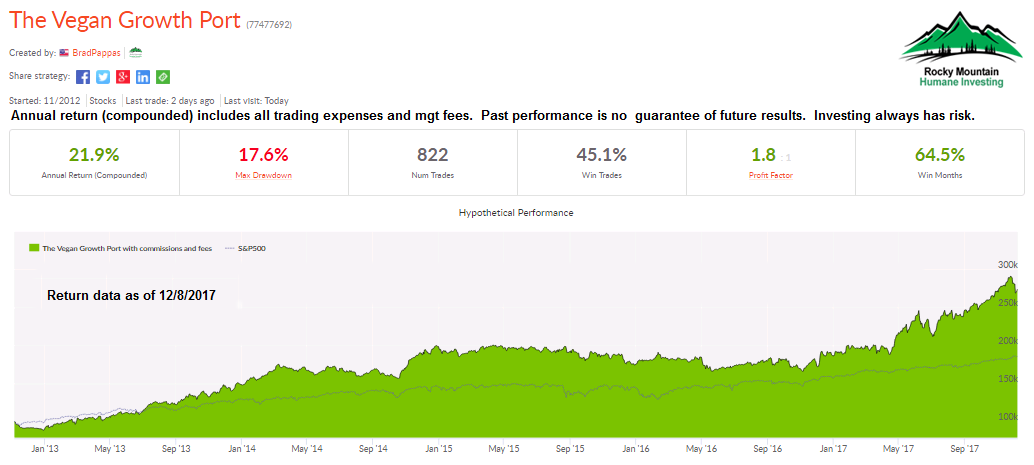

Five years is a good benchmark for any manager. In that time they’ll trade and invest through several market environments, both good and bad. Plus, five years eliminates most of the possibility of having a tremendous single year but what do they do for an encore: can they repeat themselves?
As an Investment Advisor I’m a bit of an idealist. I would like my portfolios to maximize their return potential with a sane level of risk. In addition, my portfolios should reduce chances for recession induced severe drawdowns that demoralize and defeat the majority of investors. If you sustain a -30% drawdown you’ll need to earn 42% to break even again and that can take years. The recovery from the last bear market took 4 years on a total return basis.
Another motivation for using Collective2 was that I was tired of seeing how investors were told their goals should be 4% to 7% per annum by robo advisors who only indexed money for their clients. For most people in their late 40’s or 50’s who haven’t been able to set up a decent nest egg, those kinds of returns will potentially make retirement difficult.
So here we are at the five year mark. My primary objective in creating a public platform for a model portfolio was to prove several points that I’ve been saying for years:
- Socially Responsible Investing can be effective. Social screening and the elimination of negative companies or industries has little effect on annual or long term returns. Our universe of selection is approximately 2000 stocks which have enough volume for us to trade. Simply put, if we eliminate 400 companies that would still leave us with 1600 eligible. Our average invested portfolio has 25 to 30 holdings so I don’t think we have much of an issue.
- The strategy utilized by a portfolio manager has a profound effect on risk and return. In addition it sharply increases the chance for long term success for investors. Most investors can’t take on the risk of Buying and Holding like Buffett. IMO, the 1% client is shown more sophisticated and possibly more effective strategies than the retail public which is shown primarily mutual funds and ETF’s. So why can’t we offer our version of Trend Following to the Socially Responsible Investor?
- Higher returns do not have to mean higher levels of risk. The use of proper position sizing and risk control plus tracking monetary policy can reduce risk in most cases. Brokers and planners love to use the argument of “This is what happens when you miss the the 20 best days of the stock market” (your return drops). Funny how they never mention “This is what happens when you miss the 20 worst days” (your return rises) See: Stock Market Extremes and Portfolio Performance.
- The effectiveness of “Buying and Holding” is cyclical. Every period in which B&H works is followed by a prolonged period when it doesn’t. A B&H investor takes on more risk with higher volatility along with severe portfolio value drawdowns than the Vegan Growth Portfolio. In other words, expect to earn 7% to 9% per year with periodic drawdowns of -30% or more.
- It is possible and not that hard to beat the return of the S&P 500 Index. The standard rhetoric of the Index Investing industry is reliant on showcasing their Index funds versus poor performing funds or managers. But what about the managers whose portfolios don’t fall into the majority of lagging performers?
- Private portfolio management can be a better alternative to mutual funds, if managed correctly, For a comparison: Socially Responsible Mutual Funds.
Over the years I’ve interviewed hundreds of investors, so these are a collection of commonly asked questions:
The CAGR return is 21.9% but what is the gross return before fees and expenses: As of 12/8/2017 the gross return is 23.9%. This assumes an account over $100,000 and a base fee of 1.5% per annum. High account values have lower fees. Broker commissions are a negligible factor.
What are your holdings? Holdings are private but be assured we do not own anything we object to as listed on our website. However we do chat about holdings on Twitter and other social media. I’d also like to emphasize we don’t use margin, options or futures. On rare occasions we may use a leveraged index fund as a form of hedge against long positions to preserve account values.
Do you ever own bonds in the VGP? Yes, Treasury bonds are critical to own during the time between business cycle peaks and recession troughs. They were owned by the Vegan Growth Portfolio during 2015 and early 2015 in the VGP Model.
Why not show actual client returns and not a “Model”? A million reasons: A “Model” is an ideal and not prone to withdrawals or other client activity. It represents how our portfolios would earn if left untouched and fully invested for the entire year. On a daily basis, I check the performance of the VGP Model on C2 and compare it to accounts at Schwab for divergences.
Clients frequently generate account activity or can receive different prices to buy or sell. We make a conscious effort to keep client returns close to the Model but over time divergences can occur.
In addition, not all client account sizes are the same. We don’t invest $50,000 the same way we would invest $500,000.Account holdings are not always identical. I wish I had every client own $SQ or Square this year but it moved higher so fast we halted buying before everyone was invested.
On the C2 website it says the returns are “hypothetical” why is that? C2 is required by the SEC and state authorities as a Registered Investment Advisor to state the returns are hypothetical. Even though a great deal of money is moved with a C2 transaction, it is still required. The fill price for the VGP Model can differ slightly by the fill price for the investor.
Thanks for reading. We’d love to learn how we can help you meet your retirement goals.
Brad Pappas
President, RMHI
Brad@greeninvestment.com
970-222-2592
The information provided here is for general informational purposes only and should not be considered an individualized recommendation or personalized investment advice. The investment strategies mentioned here may not be suitable for everyone. Each investor needs to review an investment strategy for his or her own particular situation before making any investment decision. All expressions of opinion are subject to change without notice in reaction to shifting market, economic or political conditions. Data contained herein from third party providers is obtained from what are considered reliable sources. However, its accuracy, completeness or reliability cannot be guaranteed. Past performance is no guarantee of future results.
Follow RMHI on Instagram to get insights into stocks we are watching and trading. Also featuring occasional impromptu photos of our main office: myself, our rescue dogs and the gorgeous Rocky Mountains that surround us. Username: RockyMtnHumaneInvesting.-
Cheers,
Brad Pappas
970-222-2592
brad@greeninvestment.com
I love it when we find a “Green” company that meets our criteria for investment and has a proactive environmental profile, this is the case with SolarEdge Technology.
Its no secret that Solar was one of the worst industries to invest in last year but stocks in the Solar space are turning up in 2017. This year many Solar stocks made a bottom and SolarEdge Technology has moved up rapidly since its February low. Its a volatile stock and that can be tempered with a lower than average weighting in our portfolios.
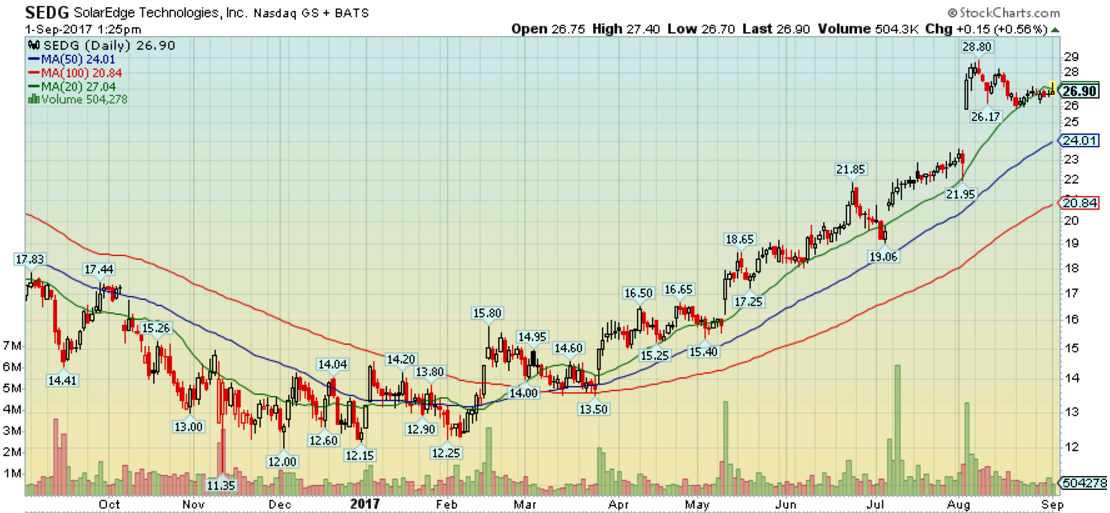
We own shares in client portfolios.
Please consider donating to the Houston SPCA, I did. They really need every dollar they can raise.
http://www.houstonspca.org


