When is a good time to sell?
(Answer: not now)
March 2017
Summary: US equity markets remain in a strong uptrend which shows no signs of abating. Markets that have broken out from multi-years of trendless behavior can last for quite a while and deliver significant returns. So at this point we need to sit tight and let the rally continue and grow our equity. I will continue to allow our good performing stocks run as far as they’re trends remain intact. Almost all the activity in your accounts is related to the laggards and losers as I have minimal patience when better options present themselves. Our focus remains on the two best performing industries: Semiconductors and Finance.
In addition, I’m seeing a change in character in two industries thought to be in the dumpster: Solar and phones companies (Specifically, Canadian Solar -CSIQ, America Movil -AMX and Nokia -NOK). If any of these stocks are genuinely in a new upward long term trend they would likely be home run stocks, but time will tell.
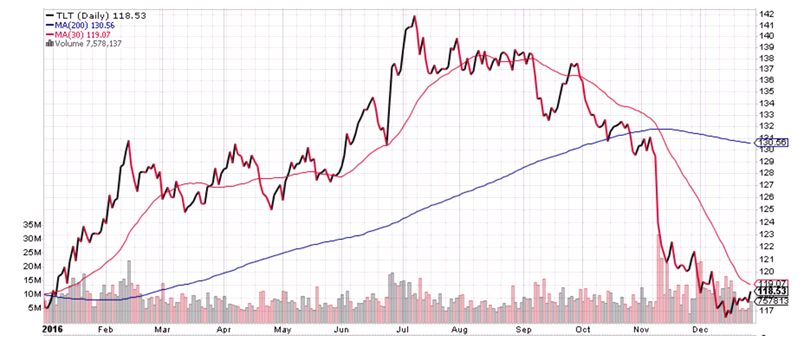
Treasury bonds and interest rate related securities continue to act poorly and are to be avoided. This poor action is a positive sign for stocks as they’re a sign of a healthy economy.
_________________________
Markets and economies are cyclical and you can add recessions/bear markets to the death and taxes mantra of sure things we’ll experience. In these letters in the past I’ve generally focused on the economy or interest rates as a tool to identify high risk environments. So, in this letter I want to spend a little time on what I call our “Primary Trend Filter”.
The primary purpose of having a Primary Trend Filter is to eliminate emotions and avoid the big loss from the investment process. It’s too easy to fall prey to emotions in a rising or falling market where you lose objectivity to the prevailing trend. In addition if you’re over 50 years old time becomes an issue as you have fewer years to recoup the loss.
Just about every study I read regarding losses assumes the investor is “buy and hold” with the silent assumption that it’s impossible to “time” the market. Not only is this wrong but it’s highly biased based on the compensation plans of the mutual fund industry. Funds are paid top dollar when you’re invested in equity mutual funds and receive minimal compensation when you’re in cash or Treasury funds.
Investors are bombarded with subjective media. Today, 3.13.2017 I received an email from the investor service Zacks titled “The S&P will double in 5 years.” To quote; “Sounds like a Herculean task on the surface, but it’s really not. In fact, the market only needs to gain on average of 14.9% per year in order to do so. That’s not such a stretch given the market has been averaging 14.9% per year since the bull market began in early 2009”……..
“My 5 year doubling thesis also means that we won’t see another recession until stocks double again,nor will we see another bear market until stocks double again. Got it?”
At no point his article does he even mention interest rates, the effect of past Quantitative Easing on the “14.9%” returns or the Federal Reserve. Why interrupt a good story with the thought of higher interest rates.
Predictions like the market will double in five years have no basis in a serious investment conversation and are meant to sell memberships and generate publicity. And, there is no accountability if the author is wrong.
On the flip side of the markets is this generations Dr. Doom, Mark Faber. He sells his version of fear with almost an annual prediction of a crash. He’s right about once a decade and he never changes his tune but how objective can he be with https://www.gloomboomdoom.com/ as his domain?
Will either be right, who knows? But these kinds of calls are common and best ignored. Prediction odds are always a coin toss although some are 50-50 and some are 1 in 10. But they’re all guesses and nothing more.
Rather than basing a strategy on someone’s subjective opinion, I’ve found that objective mathematical systems are far more accurate and profitable. They make far fewer mistakes and can prevent an investor prematurely buying or selling. Many pundits can only wish their calls were as accurate. These
systems will never get you out at the absolute top or bottom but they will have you correctly positioned for the bulk of a new trend.
These types of systems are especially valuable to those of us who can’t afford a 30% decline (as if anyone can) but still need the returns generated by stocks. Unfortunately for most investors these tools are generally not utilized by most financial planners, brokers and absolutely not used by the mutual fund
and robo-advisory industry. These outfits rely on “buy and hold” with the inevitable risk of big downdrafts.
But they are in various forms utilized by some of the best independent advisory firms, independent and institutional proprietary traders.
The following two graphs are my primary exposure filters for stocks. I also use several monetary and leading economic data for confirmation. When they give a green buy signal we know the odds are heavily in our favor. I only want to have stock exposure for my clients when the odds are in their favor
otherwise cash or Treasury bonds are a better alternative.
Primary Trend Filter #1
This is a system I created with Cesar Alvarez of Alvarez Quant Trading. It’s a simple (simple is good) moving average crossover system that in testing since 1986 delivered a higher annualized rate of return than buy and hold. Using this system the CAR (compounded annualized return) was 9.7% versus 7.9%
for buy and hold since 1986. Best of all, it lowered the maximum downside risk significantly.
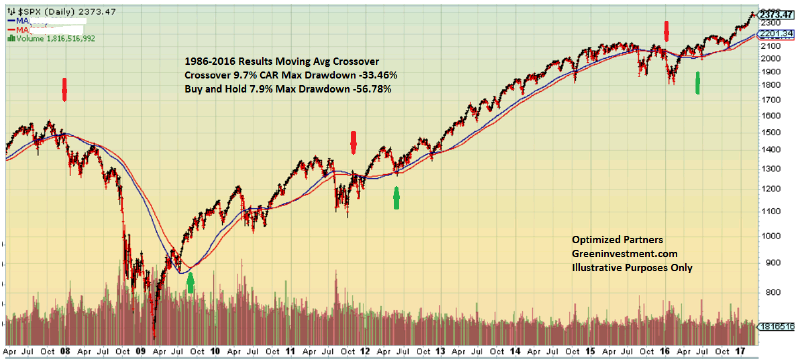
The worst calendar year for this system was 2008 when followed strictly generated a loss of -9.39% but compared to buy and hold the loss was -38.49%.
In reality I don’t often wait for a system like this to trigger if the downside momentum is too great as was the case in late 2015 and 2016. The rapidly falling momentum in those instances told me that a break of the 200 day moving average was inevitable and the poor economic data backed up the sell
signal. So I didn’t wait for the formal signal to keep any losses to a minimum.
I’m not interested in market timing systems that increase return, what I’m primarily interested in is reducing downside risk. The by-product of reduced downside risk is a higher rate of return. Profits will take care of themselves but big losses are to be avoided.
Primary Trend Filter #2
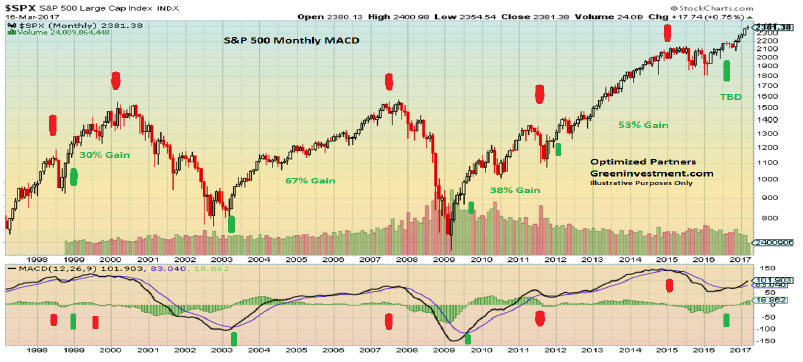
The MACD indicator shown was developed by Gerald Appel of the old Systems and Forecasts in the late 1970’s. In most cases this indicator is used for short term time periods but I think it’s of special value when looked at on a monthly basis. It’s a very slow moving indicator whereby the buy and sell periods
tend to last for at least a year. It also caught the tumultuous 2015-2016 period and flipped to a Buy last summer.
One might ask when looking at the Sell signals whether it’s a good time to short stocks in anticipation for a prolonged bear market. I’d say yes but for only a small percentage of capital since bear market volatility can be huge. Better yet, the sell signals happen to be great signals for buying long term
Treasury bonds. The price appreciation of long term Treasuries tend to move into their own bull market as a “flight to safety” from stocks to bonds emerges.
Lastly, as you can see in both charts now is not the time to sell. Market tops take time to develop frequently a year or more in the making. Considering that we just broke out from a 2 year sideways trend our current rally could last quite a while. Eventually it will end and that will likely coincide with
peaks in employment and an aggressive Federal Reserve and the behavior of the stock market will be reflected in the charts above.
In the meantime market pullbacks will likely be shallow in the 5% to 8% range before prices launch the next leg higher.
Cheers,
Brad Pappas
Perhaps that I feel some works of charity should not be hyped. I’m very old fashioned in that regard and view that charity should not come with strings nor attention but times are changing. I’ve always admired when an athlete or celebrity engages in some charity but demands there be no publicity. May the angels come to your rescue if you publicized all-time hockey great Bobby Orr spending an afternoon with a Cancer stricken child and family in his own home.
That being said, I’ve been asked to mention that since April 2015 a portion of our client fee’s have been donated to Kiva.org
The current administration’s view of withdrawing financial aid to needy countries and causes places everyday people and organizations to fill in the gaps. I expect we’ll see some form of activist funding to fill in the gaps voided by new administration policies for the Arts, Planned Parenthood, school lunches, homelessness, military family support, climate change and technology, LGBT rights, etc.
We’re just doing our bit.
If you never heard of Kiva.org they’re a non-profit micro lender for small borrowers around the globe. They offer funding to vast array of borrowers and purposes in some of the most dangerous and remote parts of the world.
Quarterly, we allocate a portion of our collected client fees and assign them to Kiva for loans. When the loans are repaid (some do default) the funds are recycled to new loans. In my mind there is no “profit” in these loans and we don’t intend to ever reclaim the funds. We intend to let them recycle through the Kiva system indefinitely.
We’ve made 44 loans since 2015 and rank in the top 8% on Kiva for loans made with just 3 defaults and only 4% delinquency rate. Our loans have been apportioned to 22 countries. I generally have a theme to our loans: Education, small business support like Taxi’s, transportation and clean water. The loan destinations won’t be making Travel and Leisure’s hot list of cool countries to visit anytime soon. More likely to be found on the list of “most dangerous countries to visit”.
Anyway, it just feels good.
Brad Pappas
I should get around to doing this more often as we are in the minority when it comes to investment advisors willing to post portfolios and returns. I’ve advocated for years that retail investors don’t have to settle for the returns offered by indexers and robo-advisory firms. Robo’s are cheap but you won’t receive what we offer in terms of returns and bear market protection.
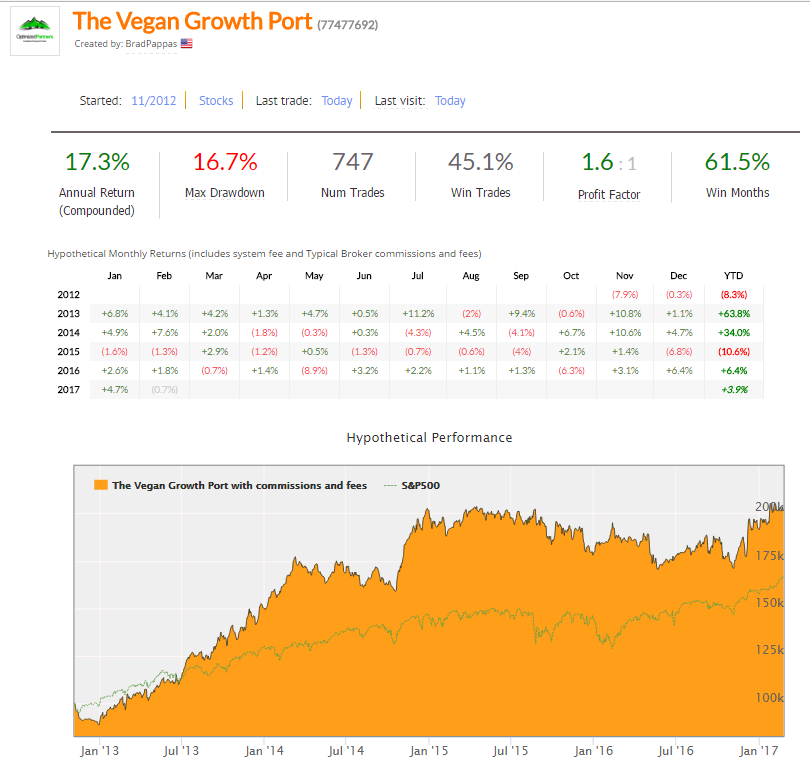
The Vegan Growth Portfolio is a name we use to describe the concept of investing with Vegan perspective. Its a diversified portfolio that usually has about 30 holdings when fully invested. When our indicators tell us that when stock market risk in unacceptable due to the potential for recession we reduce our stock holding and focus on Treasury bonds or cash.
Collective2.com offers a unique opportunity to create a mirror portfolio of our client holdings in the Vegan Growth Portfolio. In other words, the same day we buy or sell a stock for our clients we also buy or sell it in the VGP. The price may differ by a small amount but the Vegan Growth Portfolio shown on Collective2.com is close approximation to our client accounts.
As you can see we are soon arriving to the important 5-year return milestone. As of 2/24/2017 the compounded annualized rate of return is 17.3% which is net of all fees and expenses. The gross (before fees) return is 18.8% per annum.
We respectfully ask when a potential client’s first question revolves around fee’s is which would you prefer: Make 4%-6% net at a indexer or robo-advisor like Betterment or our returns which charge more?
This example assumes and account size of at least $100,000. And, as we always have to say past performance is no guarantee of future performance. VGP is only suitable for investors who appropriately seek growth.
In loving memory of our dear girl Alexei who passed away today from cancer at just 5 1/2 years old. Many thanks to Dr. Boo and the caregivers at Colorado State University Veterinary hospital, we did all we could to help her.
Our ranch and family will never be the same.

In loving memory Alexei
The next four years could be a bit awkward especially for new readers. One might assume that I applaud the Trump Presidency but my political and social views are of secondary concern. My role is to interpret the direction and behavior of policies and markets and hopefully be on target.
Quick Summary of 2016: One year ago our base case scenario was the economy and markets were rolling over into recession and that downside risk of stocks was much greater than the potential upside. This proved to be the correct assumption as many categories of stocks (especially Value stocks) were in full-fledged bear markets. We avoided a sharp 15% decline in January-March and the Brexit decline in July. During the April-May period forward looking economic data began to improve sharply and the recession was avoided (first time for such a turnaround since 1985). While I deeply regret lagging the major indices in performance this year, the risk/reward last Spring was disproportionally negative and preservation of principal is always my #1 priority. 2016 will represent an economic mid-cycle bottom which supports the prospects of acceleration in 2017.
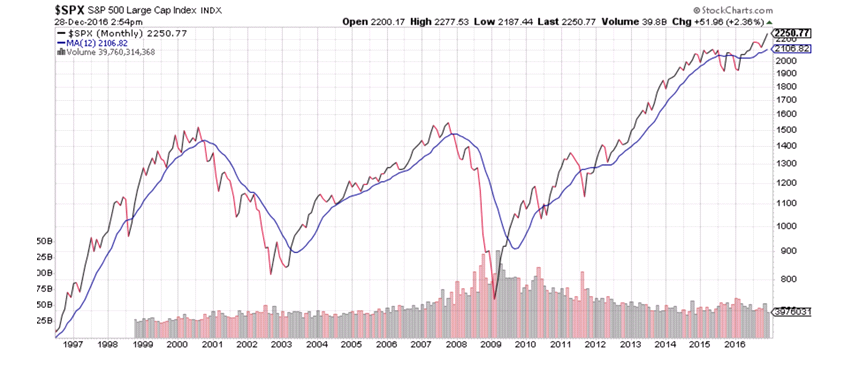
Below is a basic trend model which uses the 12 month moving average (ma) of the S&P 500. When the SPX is above the 12 month ma the trend is bullish/positive. Moves below the 12 month ma indicate a potential change in trend and a time for caution. It’s not perfect but when combined with an eroding economy the results can be devastating to the Buy and Hold investor not paying attention.
And then there was the election……
We’ve now had just over a month and a half since the election during which the fundamental approach to fiscal and monetary policy had been turned upside down.
If Hillary Clinton was elected last month with Republicans maintaining control of the House and Senate would have represented maintaining the status quo regarding the use of monetary policy as the only tool to defend against the next recession. This implied that the US would likely have gone to 0% or less interest rates when the next recession occurred. A powerful fiscal stimulus plan was out of the question with Republicans control of Congress. This implied that we were staring at the next 8 years believing the odds of recession were high but policy response was restricted to whatever the Federal Reserve could accomplish as it was the only tool available. Given that interest rates were already very low, the possibility of negative rates was real.
Since the election this perception has monumentally changed. It’s now obvious that any future recession will now be met with both Monetary stimulus and a huge Fiscal stimulus package. Markets are smart enough to know the only reason Republicans opposed a Fiscal stimulus plan was that a Democrat was in the White House. While DT may laud himself for this change in perception it’s likely that it would have happened with any Republican winning the Presidency. It’s my belief that this premise caused Treasury prices to plummet in one of the worst 30 day periods since 1980 and for stocks to spike higher.
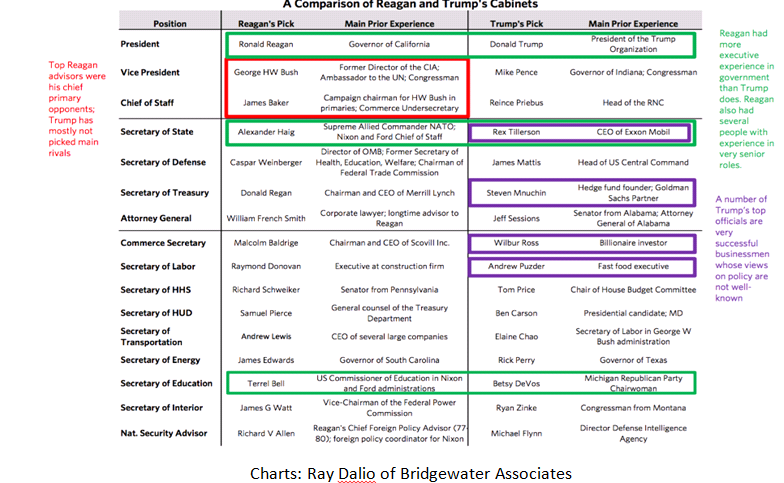
With the addition of the cabinet picks it’s becoming obvious that there we’ll experience a profound ideological shift led by a President who loves to negotiate hard and doesn’t mind being the bull in a china shop. It appears his cabinet is being filled with those hell-bent on making big changes in policy primarily in reversing many of the post-2008 reforms. This shift in attitude and direction reminds me a great deal of the transition from the Carter to Reagan Administrations where we went from a low growth/cautionary Presidency to an Ayn Rand influenced direction.
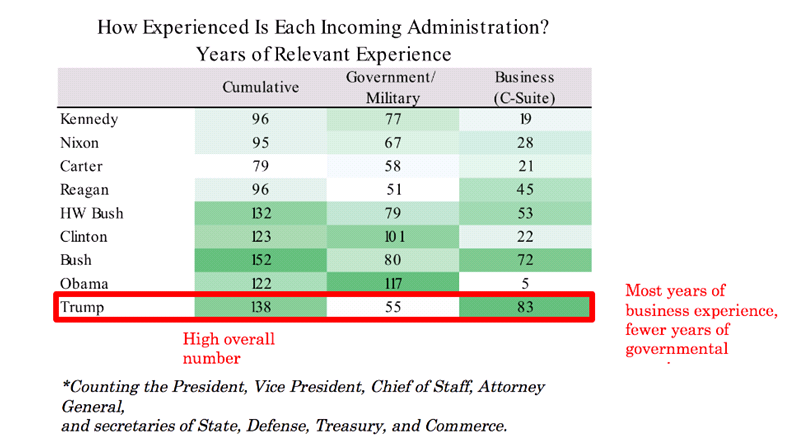
Trump’s cabinet is a reflection of his business perspective and the direction he wants to take the country. The chart below shows the business/government experience of his top 8 picks in cabinet. By far, Trump has assembled a cabinet with the greatest amount of business experience and it’s my expectation that this is a business first administration.
While the final policy drafts remain to be seen the impact on the US economy, the potential shifts in tax and fiscal policies alone could create a virtuous shift as money comes out of cash to risk oriented investments. Money always tends to be attracted to places where it’s well treated. A pro-business administration with the rule of law and political stability would offer a very attractive landing spot for foreign capital.
What could go wrong?
Since Donald Trump’s ego is on continual display my belief is that he does not want to be remembered as a Presidential failure but it won’t be easy. Abandoning environmental, the ACA, social progress, immigration and avoiding the real driving issue of under-employment (Robotic Automation) leaves him very vulnerable. His political platform on employment is detached from the reality of advancing productivity via technology.
In addition Trump lost the popular vote by close to 3 million and has the lowest approval rank of a new president in recent time. Add to this a popular (60%+ approval), eloquent and young former President to play the role of Devil’s Advocate with preservation of progress in mind.
Of course, one has to wonder if the incoming administration and cabinet will not only just be aggressive but will they be thoughtfully aggressive?
All these potential pro-growth initiatives would have you believe that unemployment is high but employment is not high, it’s 4.6%. At 5% or less is about the level where historically the Federal Reserve will begin to raise short term interest which will have a dampening effect on the economy to lower the risk of inflation.
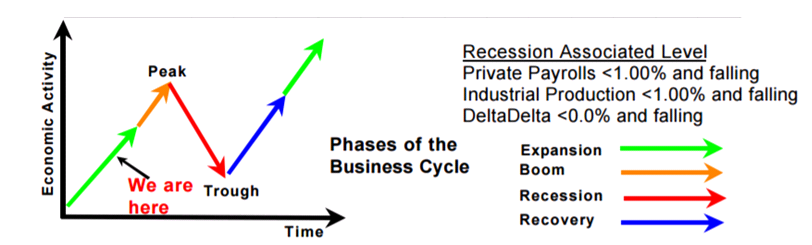
Many times over the years I’ve mentioned Bob Diehl of Nospinforecast.com and his documentation of the business cycle. According to Bob from the chart below we are approaching the “Boom” phase of the economy where employment really starts to tighten and the Fed gets quite aggressive putting on the brakes. My sense is that Trumps policies will likely ignite the Boom phase and result in a battle with the Fed unless Trump can replace the inflation hawks on the Fed Board when most are up for re-appointment in 2018. Even if Trump does replace the Fed board he could ignite a significant hike in inflation.
Odds are quite high that Trump will have to deal with a recession at some point, especially if he serves an 8-year term. How will he cope with that given the sky-high expectations he has created for his presidency?
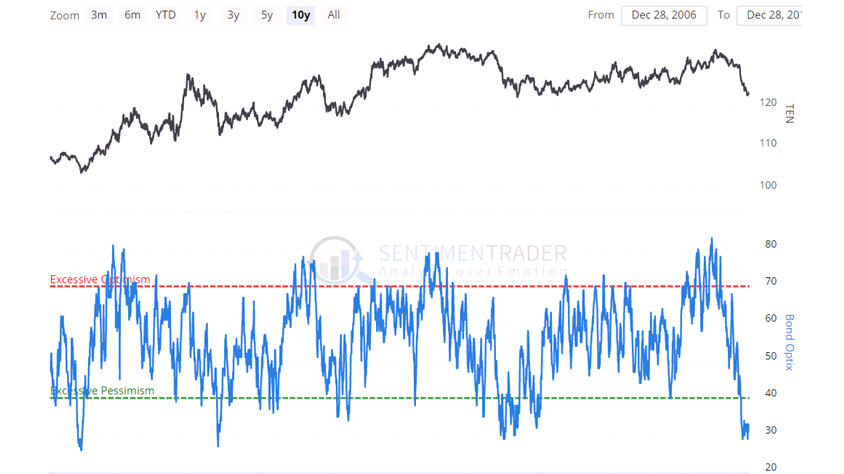
Balancing Trump risk with Treasuries, Utilities and REIT’s: The surge in stocks came at the expense of bonds and it appears that Treasuries are putting in a bottom, at minimum the risk after the decline may not be much at all. Investor sentiment for bonds is the polar opposite of stocks which means extremely negative and so much of the risk is likely washed out for now.
Below is the TLT which is the 20-30 year Treasury ETF at $118 might now be suitable for intermediate to long term investors. This is the same holding we sold 20 points higher at $137 to $139.
The broad sell off in bonds has created what could be an excellent long term entry point for interest rate sensitive investments such as water utilities and real estate investment trusts.
Investment selection for the new administration: The Return of Value hedged with interest rate sensitive holdings
Had HRC won the election there would have been no pivot to Value oriented stocks and strategies at the expense of traditional growth stocks especially Tech stocks.
In addition, with the prospects of a Fiscal package coming in the next year or two beaten down Value stocks and Value strategies have come back to life. Value generally doesn’t do well when a recession is looming but Value is also the place you want to be when economic cycles bottoms as it has this year.
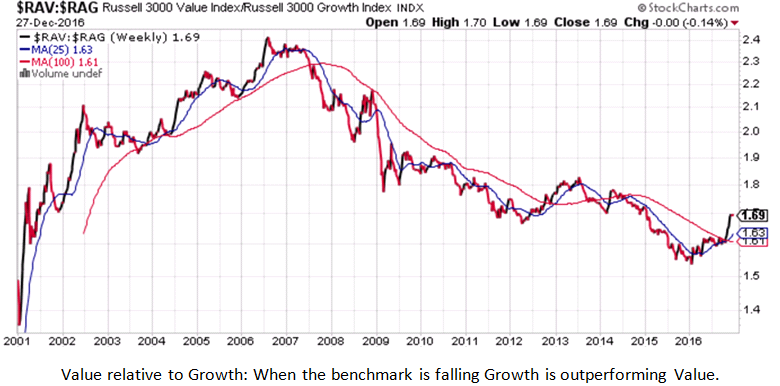
The graph above highlights the relative performance of Value stocks compared to Growth stocks. Value did very well from 2001 to 2007 but has lagged since 2007 with the exception of 2012/2013. With the business/economic cycle making a bottom in early 2016 we can see a turnaround to Value is now in play.
Just after the election I returned to using the investment selection factors that have proven time and again to be the most effective when Value is performing well. Plus, the Growth stocks that we own or will be purchased in the near future are in long term uptrends lasting multiple years. The pullback in Growth stocks does provide a good entry point for Amazon, Equinix, American Water, Equity Lifestyle Properties. In addition, with the understanding that this move out of the 2-year go-nowhere trading range raised the odds that this rally is part of a multi-year up move in stocks. Most of the new additions were selected with potential for long term holding periods of hopefully a year or more.
The post-election surge came primarily at the expense of bonds and interest rate sensitive holdings which were hit extremely hard. These are the types of investments that would likely do well in a slowing economy.
Considering that there is no assurance that Trump will be able to realize his economic predictions and that it’s very likely the Federal Reserve will keep raising short term interest rates there is no guarantee of the long term success of his plans especially if Republicans lose mid-term elections in 2018. Hence, the selloff in bonds and interest rate sensitive stocks makes sense given the steep selloff they’ve already incurred.
No doubt you’ll see all sorts of predictions for investment markets for 2017. Pay them zero attention as no one really ever knows what will happen in the future. Most strategists have to always be positive on markets to reinforce their brokerage force to buy stocks. Generally speaking trendlines are amongst the best tools to determine whether to be invested in stocks or not. Trendlines are price driven and
objective with no opinions to taint their perspective. In addition just by following basic trendlines like the 200 day moving average will generate returns and reduce downside risk better than any guru or strategist. While trendlines were quite negative for most of late 2015 and early 2016 they are very positive for the time being.
Have a great 2017 everyone!
Brad Pappas
trump-november-16-client-letter