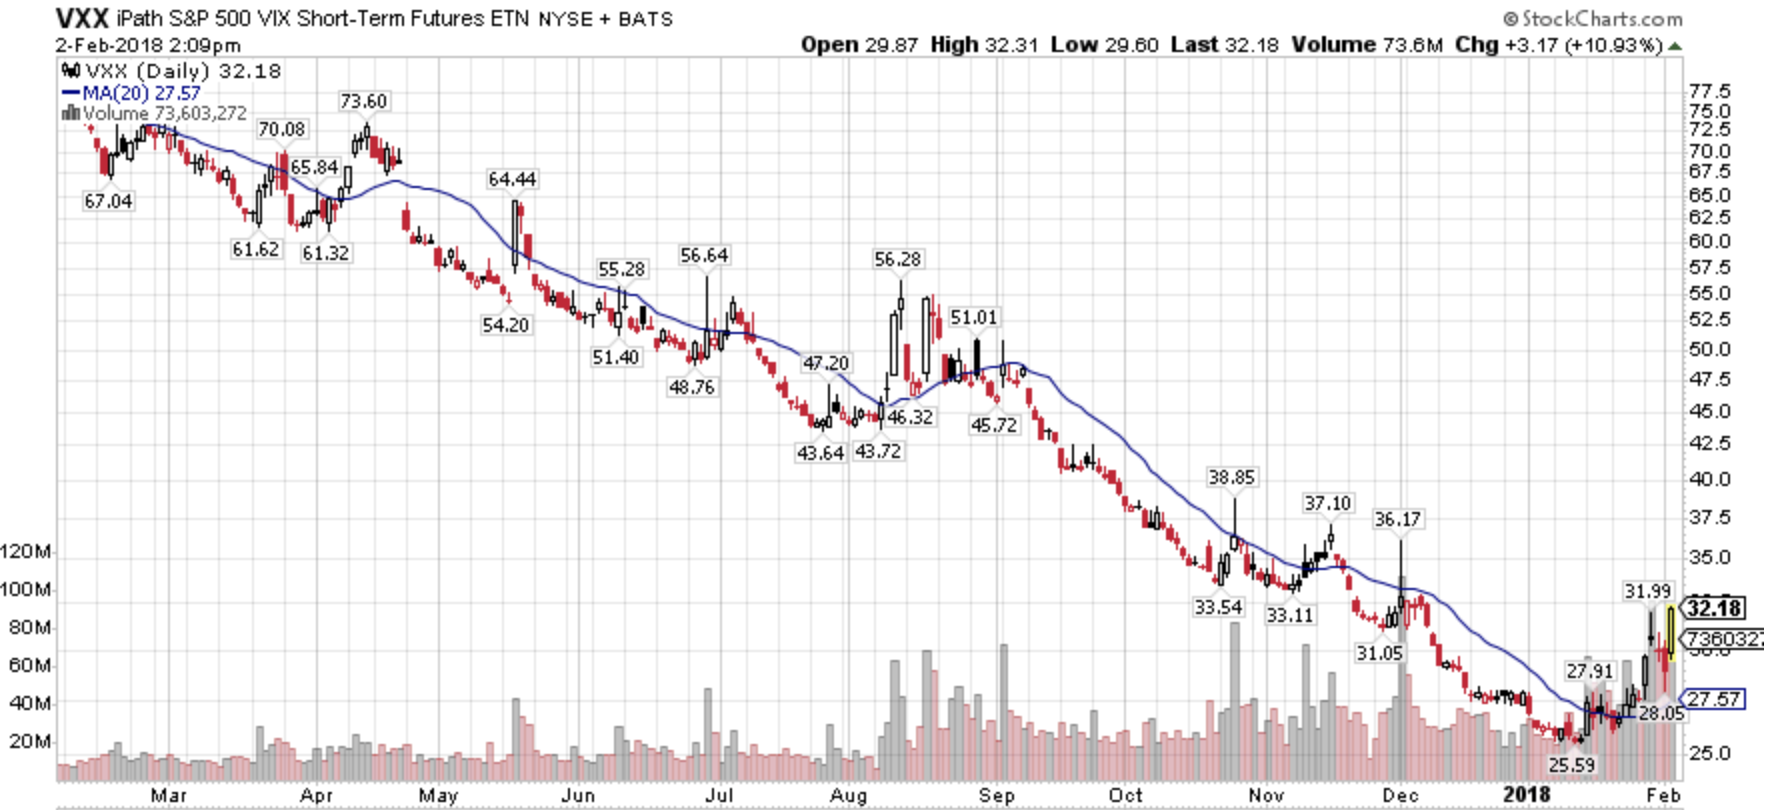
Coolest chart of the week 2/2/2018
VXX continues to rise which implies further stock market weakness. Long VXX
VXX continues to rise which implies further stock market weakness. Long VXX
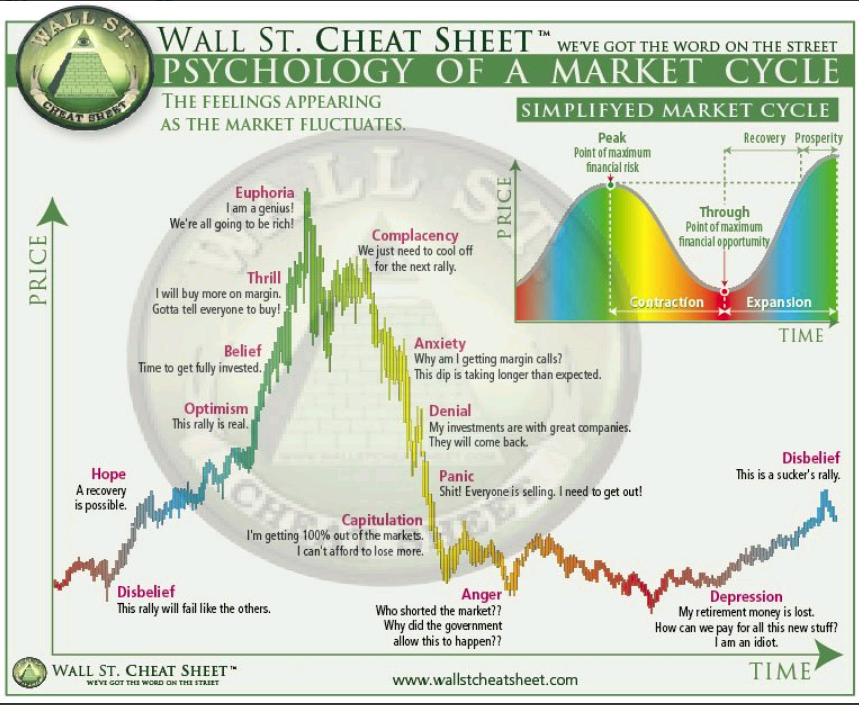
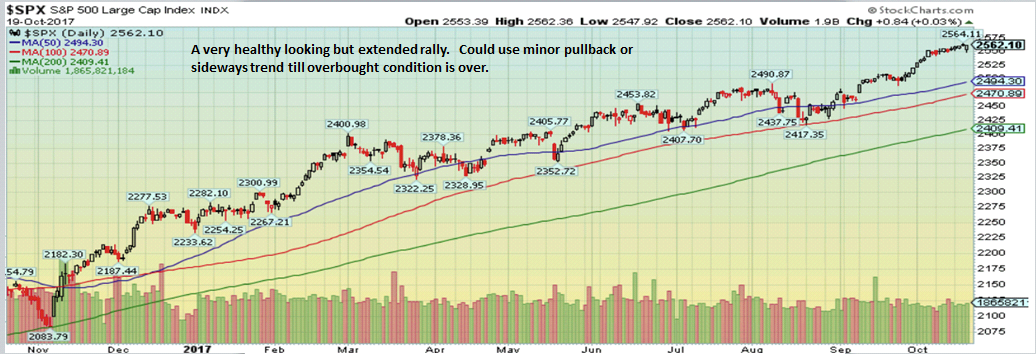
Since the market bottom last November the S&P 500 has rallied from 2083 to 2560, a very healthy gain of 22.8% not including dividends. Despite these gains there are almost no signs of euphoria within the investing community which leads me to think this rally still has a long way to go. Euphoria is a necessary evil that’s almost always seen at major market highs when investors refuse to believe the market will roll over.
Is there a valid case to be Bearish? Yes, but market momentum always takes precedence. Eventually the bears will be right but it may take a few more years and in the meantime so much opportunity will be lost. The bearish arguments have been around for years and completely dismissed as markets make new The bear case always sounds intelligent and well thought out but their losses and opportunities missed can be staggering.
This week marks the 17th time in the past 90 years that stocks made new all-time highs each day of the week. In only ONE instance did this ever mark the exact top of the stock market (1968). Higher highs occurred 94% of the time.
Once a trend has been established it tends to persist and run its full course.
Investing always has some form of anxiety for investors to contend with. If it’s not nervousness with the decline in your account value it’s the fear of the value rising too much and worrying you’ll give it all back. Is there a Goldilocks too hot – too cold – just right equivalence? Nope, but keep things simple as in try to sensibly grow your principal as much as possible in the good years and lose as little as possible in the bad. And, try not to mess it up in the meantime which is why: Temperament can more important than intellect.
In past years bonds offered a decent yield which allowed an investor to gain some income and diversify from stocks. The problem in this era is that yields are very low and in order to gain a modest, even a high single digit return there must be some increase in bond prices and very little of that is happening now.
One of the best books ever written on investing was authored by Jesse Livermore “How to trade in stocks” published in 1940. At his peak Livermore was worth an estimated $100 million in 1929 dollars after starting from scratch. His approach was systematic and still effective today and I use many of the rules he originally created for himself.
One of Livermore’s lessons was: “Money is made by SITTING not trading” To paraphrase, when you know you’re in the right you stay invested until the rally fades. You should remain in the stocks that are trending higher and take small losses along the way (never ride a losing stock down hoping it will turn).
The majority of “easy” money made in stocks is made during two unique phases of the economy/markets: The violent rally higher during the transition from recession to expansion and during long trending rallies in the mid cycle of the expansion like we’re experiencing right now. Smooth trending markets may happen just once or twice in a decade so it’s important to maximize the opportunity when it’s present.
While it’s part of our management philosophy to protect our clients during major down drafts, we do not sell prematurely or pretend that we can call a market top. “Top Calling” the stock market is a way of gaining media exposure and attention. Top Calling has nothing to do with solid investment management since astute advisors know it can’t be done. The better option is to let the market take us out when the time is right with our built in exposure systems.
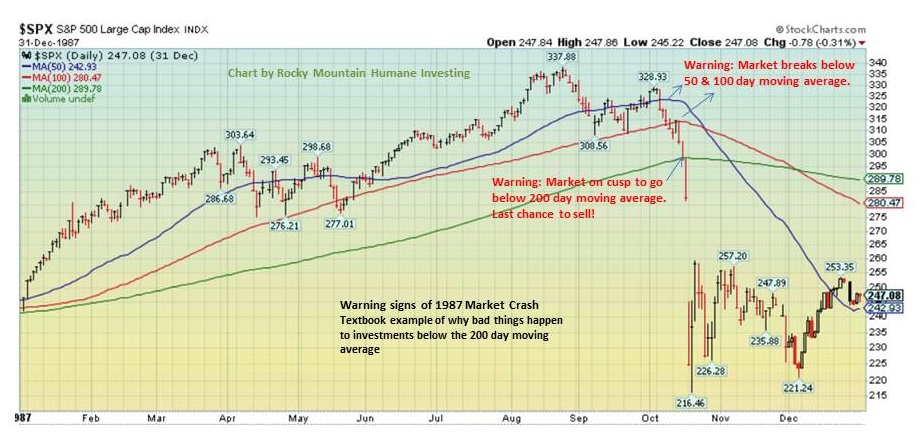
Charting the warning signs of the 1987 crash
It’s been 30 years since the 1987 crash so why not look at it closely for lessons?
The evolution of market tops is a gradual process whereby markets weaken as selling and distribution increase. Sometimes the flat sideways trend is nothing more than the “pause that refreshes” before another up-leg commences. However, sideways/choppy trends can also be the early stage of something more ominous.
In the summer of ‘87, the bond market was very weak with declining prices and higher yields which were becoming increasingly more attractive to stocks. This was causing a migration from stocks which began to manifest itself in August. These were the grand old days when investors wouldn’t buy a municipal bond unless it had a tax free yield of 10% or more.
Stocks peaked in August then sold off by 8% in September then rallied 6% into October before crashing. The decline in early October breached the 50-100-200 day moving averages which would have triggered a wave of sell signals for us. We always use the 200 day moving average as the ultimate cut off for owning stocks. I consider declines below the 200 day to be Bear Market country.
Summary: Enjoy the ride.
Brad Pappas
970-222-2592
Brad@greeninvestment.com
The information provided here is for general informational purposes only and should not be considered an individualized recommendation or personalized investment advice. The investment strategies mentioned here may not be suitable for everyone. Each investor needs to review an investment strategy for his or her own particular situation before making any investment decision. All expressions of opinion are subject to change without notice in reaction to shifting market, economic or political conditions. Data contained herein from third party providers is obtained from what are considered reliable sources. However, its accuracy, completeness or reliability cannot be guaranteed. Past performance is no guarantee of future results.
At present we have 35% of client assets in cash as the markets have receded from a high risk level. The late September/early October time period is notorious for steep market weakness. Should we witness a further pullback in the indices we’d have a low risk entry point to use our sidelined cash.
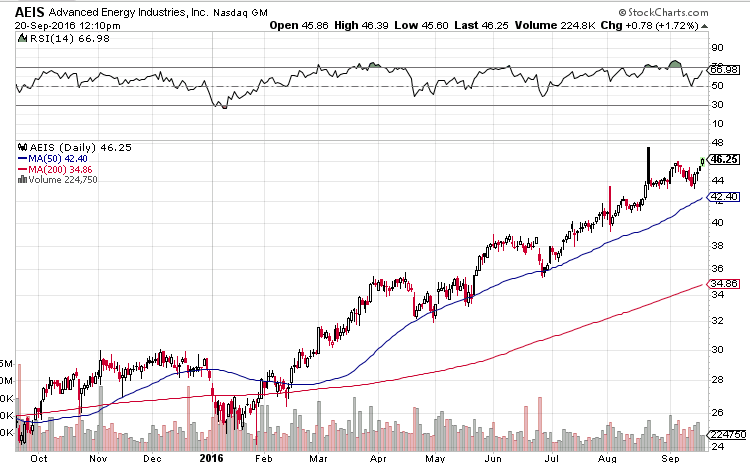
In the meantime a Green energy related company Advanced Energy Industries is behaving extremely well. We have only a small holding in The Vegan Growth Portfolio but would like to add more on any market pullback. AEIS is completely ignoring any market weakness as demand for the shares is very strong.
Long AEIS
Not since 1995 has the S&P 500 not had at least a 10% pullback. Normally, you can count on a 10% pullback within an ongoing bull market to a great time to add funds or bring new accounts online. But 2013 is the year of the relentless rally where 2% pullbacks are new 5% pullback. Extreme bullish investor sentiment which is normally a good barometer of when to ease up on portfolio exposure has been pointless, as previous blog posts have demonstrated.
So, whats going on you ask? Why is this year different from the others and what does it mean going forward?
Markets are clearly being driven higher by the Federal Reserve current policy of Quantitative Easement and its by product of 0% short term interest rates.
Its no coincidence that when the Fed ended QE1 and QE2 markets fell apart with declines of -16% and -19% respectively in 2010 and 2011.
Its fashionable right now to analyze each economic tick (especially the recent positive employment data) to determine when the Fed will end QE3. But the truth is we really don’t have an accurate guess for when that will happen.
Three things we know for sure at the moment:
1. We are in the midst of the strong season for equities and that will last until March 2014.
2. The economy as measured by employment is improving. Contrary to politically biased media outlets job growth is not coming from part time employment. GDP growth in the 3rd quarter was stronger than expected. This is market friendly.
3. Bob Dieli’s Aggregate Spread and RecessionAlert.com are both at benign/miniscule odds of recession. Market friendly again.
My best guess of what will happen? Eventually the Fed must end QE3 and the markets may anticipate this ahead of time by churning nowhere or showing internal deterioration in strength. My thinking is that the Fed will do nothing till at least after congressional budget talks in January but by the time March comes around and temps here begin to melt some snow we should be decreasing our equity exposure in a meaningful way.

A quick update on our current status:
The major market indices are at or near major market highs which will likely be a difficult hurdle to surpass in the near term.
In addition, investor sentiment is extremely positive which has negative implications going forward in stock prices.
To our way of thinking the combination of negative investor sentiment with markets at historical highs implies either a sawtooth churning market with little or no gain or a moderate decline in prices in the near term. We don’t believe at this time that a major market top is playing itself out, we believe based on Ned Davis’s market cycle analysis that a major top is due in the Spring of 2014.
All recession indicators remain in positive territory.
So, we are essentially playing defense for our clients by selling off stocks falling in our ranking systems and raising cash rather than reinvesting on the long side. We have added a significant amount of inverse exchange traded funds that should aid in buffering downside volatility in client portfolios.
Should a decline emerge to the degree that overwhelming positive sentiment is reversed we will reverse our course and liquidate the inverse ETF’s and add new long stock positions for a potential new leg up in the indices that could last to March/April 2014.
Brad Pappas